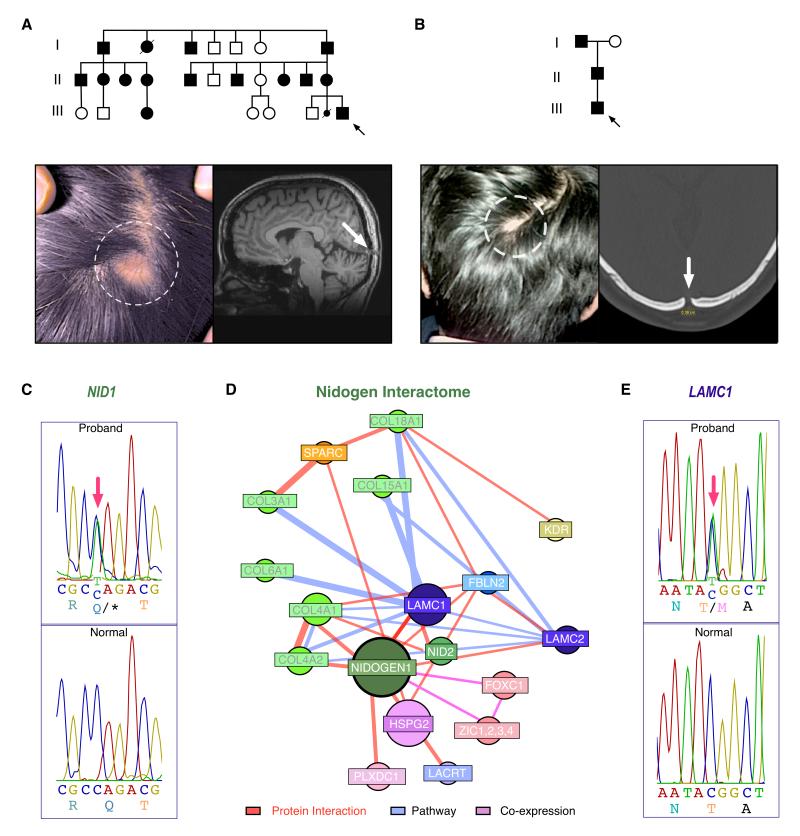
Figure 1. Pedigrees and Phenotyptes of Affected ADDWOC Families, NID1 and LAMC1 mutations, and NID1 interactome.
a. Pedigree of the Vietnamese family (Family 1) with photo of cephalocele (dotted circle) and skull defect (white arrow) on sagittal brain MRI (T1 weighted image). Black arrow=proband.
b. Pedigree of the Indian family (Family 2) with examples photos of cephalocele and skull defect on x-ray. Black arrow=proband.
c. NID1 mutant sequence from Family 1 (top) compared with the normal NID1 sequence (bottom). Red arrow indicates site of mutant nucleotide.
d. Construction of a NID1 interactome reveals putative candidates for the ADDWOC phenotype that include LAMC1.
e. LAMC1 mutant sequence from Family 2 (top) compared to the normal LAMC1 sequence (bottom).
c and e. Nucleotide numbering reflects cDNA with +1 as the A of the ATG translation initiation codon in the reference sequence (see text). Initiation codon is codon 1.

