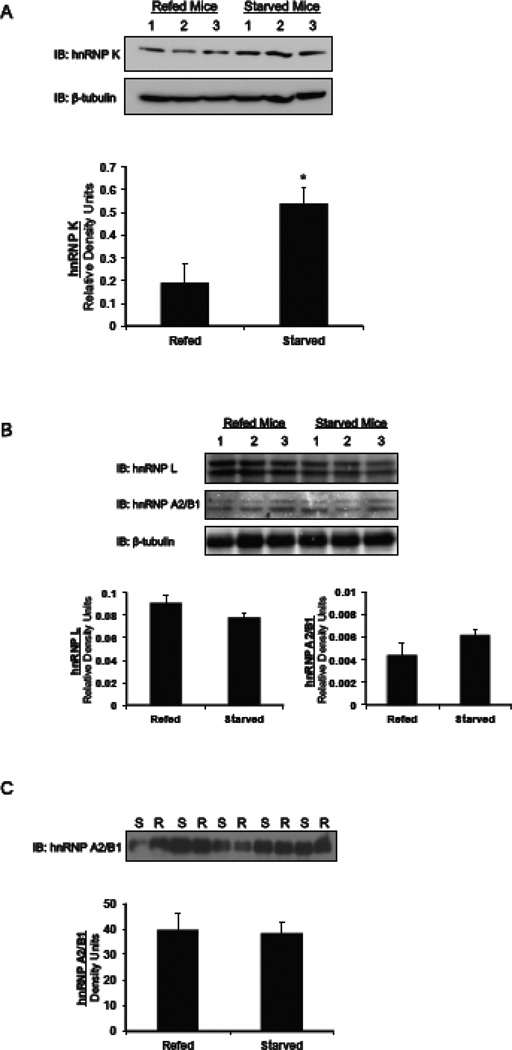
Figure 1.
Starvation causes an increase in the amount of hnRNP K protein in mice livers. Mice were either starved for 18 h or starved for 18 h and then refed a high carbohydrate diet for 12 h and protein extracts were made from the mouse livers as described in the materials and methods. (A) A western blot shows the amount of hnRNP K in the livers of mice. Each lane represents an individual mouse liver. Quantification of the changes in the amount of hnRNP K protein is shown. The amount of hnRNP K protein was normalized to the amount of β-tubulin. The data are the mean ± SE of n=3 mice per group. (B) A western blot shows the amounts of hnRNP L and A2/B1 in the livers of mice. Each lane represents an individual mouse liver. These antibodies detect 2 bands for each of these proteins. The reason for the doublet is not apparent. Quantification of the changes in the amount of hnRNP L and A2/B1 protein is shown. The amount of hnRNP L and A2/B1 protein was normalized to the amount of β-tubulin. The data are the mean ± SE of n=3 mice per group. (C) Nuclear extracts were prepared from mice that were starved or starved then refed and immunoblotted for hnRNP A2/B1. Each lane represents an individual mouse liver. Quantification of the changes in the amount of hnRNP A2/B1 protein was performed on the Typhoon imager and is shown. The data are the mean ± SE of n=4 mice per group. S, starved; R, refed. The “*” symbol indicated a significant difference (p<0.05).

