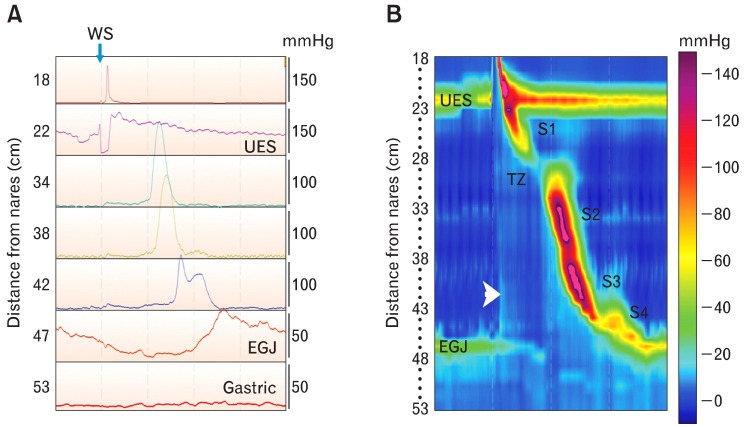
Figure 1.
Comparing conventional recordings of manometric pressure with the Clouse plot or esophageal pressure topography (EPT). Conventional manometry tracings came from catheters made with pressure sensors spaced at relatively widely intervals, usually at 3- to 5-cm. The recording on the left (A) was made with a high-resolution manometry catheter and recording system, but it is displayed in the line mode so it looks like a conventional esophageal manometry recording. Seven of 36 recording channels were chosen for display to mimic what is seen with conventional manometry systems. Channels were selected to record simultaneously from the pharynx to the stomach. With old conventional manometry systems we could not simultaneously view pressures generated by the entire esophagus, including its sphincters. Notice that pressure is on the y-axis and time is on the x-axis. The numbers on the left indicate sensor location from the nares. EGJ indicates the esophagogastric junction, and WS indicates the timing of a wet swallow. The figure to the right (B) is esophageal motor activity from the same wet swallow displayed in the color contour mode. In this mode, pressure is represented by color (color bar on the right), sensor location is on the y-axis, and time is on the x-axis. Resting upper esophageal sphincter (UES) and lower esophageal sphincter (LES) pressures are seen horizontal bands of color that are several centimeters wide. Their hues indicate pressures that are greater than in the adjacent pharynx, esophagus, or stomach. Opening of the UES and LES relaxation are depicted as changes of color to hues that represent a lower pressure. A diagonal band of color running from the UES to the LES represents the peristaltic pressure wave. Variations in peristaltic pressure are produced by overlapping esophageal contractile segments: S1 is the striated muscle esophagus, S2 and 3 are the proximal and distal smooth muscle esophagus, respectively, and S4 is the LES repositioning itself at its resting position. There is a pressure trough between S1 and S2 that is called the transition zone, because it is the region over which the esophageal musculature transitions from striated to smooth muscle. Pressure in the swallowed bolus (intrabolus pressure) is represented by a small simultaneous rise in intraesophageal pressure seen as a simultaneous change to a lighter blue color (arrowhead). Notice that when the peristaltic wave passes the color becomes a darker blue indicating bolus clearance. TZ, transition zone.

