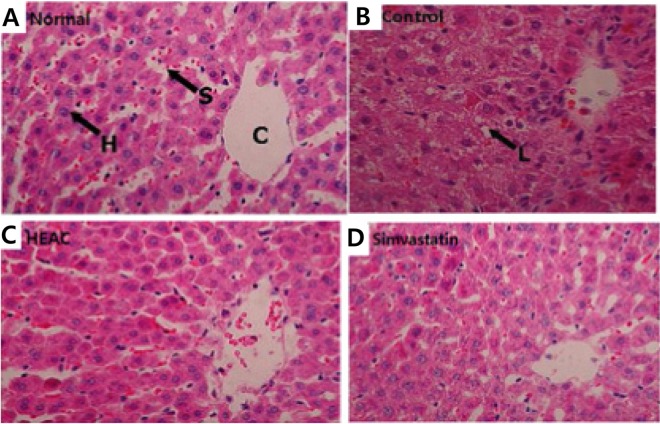
Fig. 1.
Micrographs of rat hepatic tissue (hematoxylin and eosin stain, ×400). A, Normal indicates the hepatic tissues from normal rats fed a normal diet; B, Control indicates the hepatic tissues from obese rats fed a high-fat diet. The ethanolic extracts from Hericium erinaceus cultivated with Artemisia capillaris (C) and simvastatin (D) indicate the hepatic tissues from obese rats fed a high-fat diet and treated with HEAC and simvastatin, respectively. C, central vein; S, sinusoidal capillary; H, hepatocyte; L, lipid droplet.

