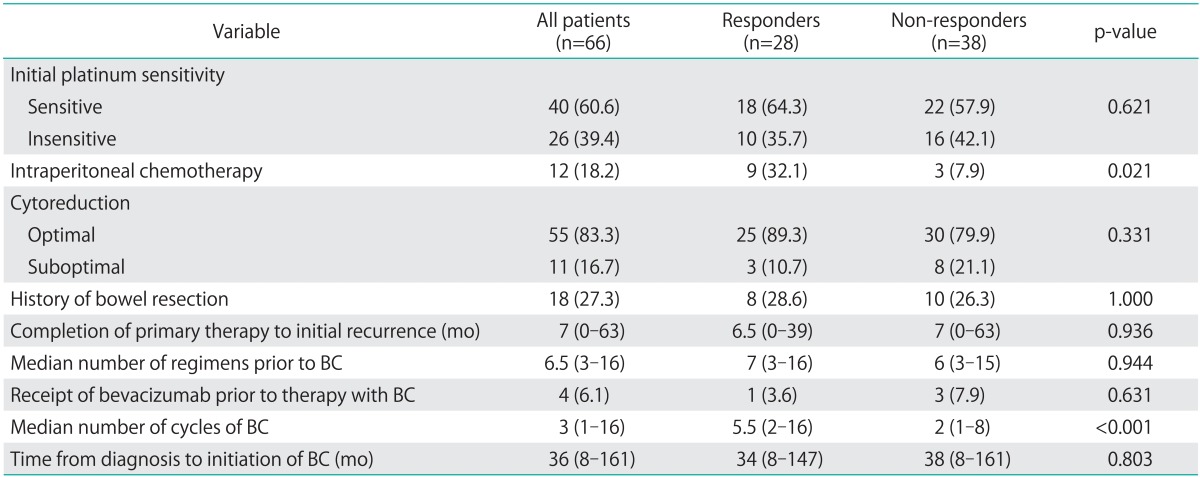
Table 2.
Comparison between responders and non-responders to bevacizumab and cyclophosphamide (BC)

Treatment history is reported for all patients. Responders and non-responders are compared. Values are presented as number (%) for categorical data and median (range) for continuous data.
