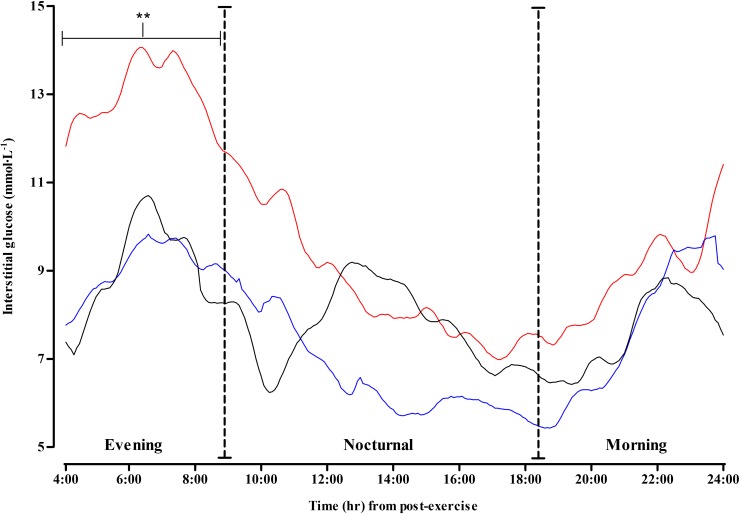
Figure 2.
Time-course changes in interstitial glucose throughout the postlaboratory period. Data presented as mean (SEM error bars have been removed for reader clarity). Black line, Full; blue line, 75%; red line, 50%. **Interstitial glucose area under the curve is significantly different from Full and 75% (P ≤ 0.05). Vertical dashed line breaks indicate evening, nocturnal, or morning periods.

