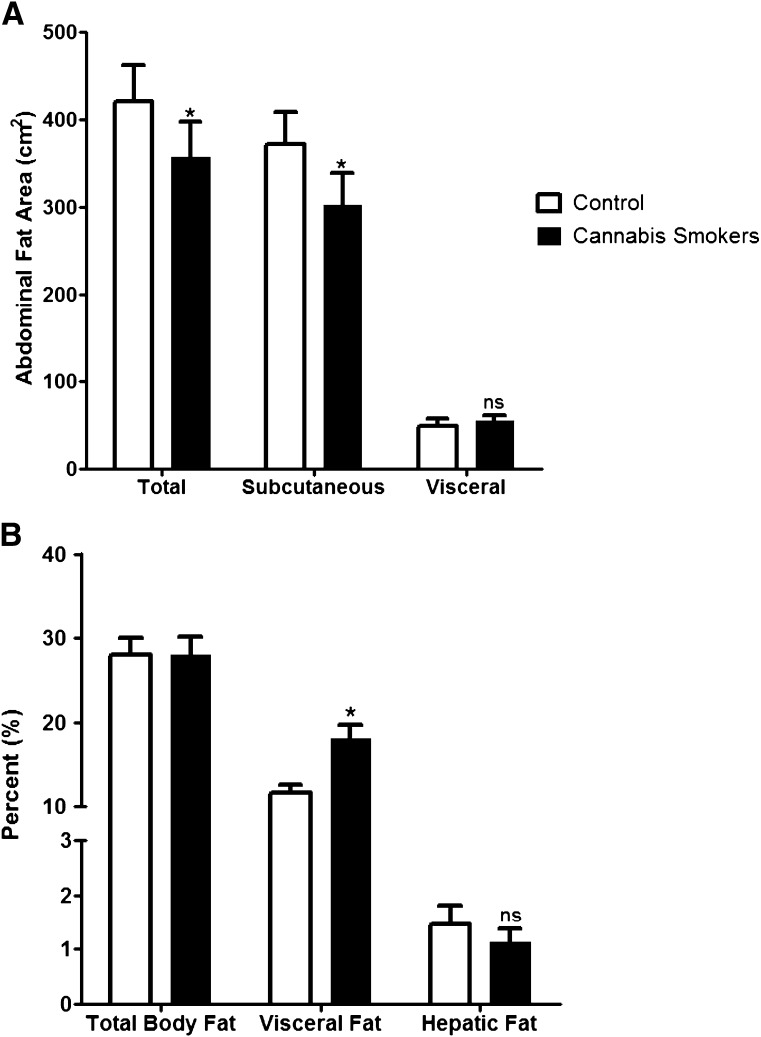
Figure 1.
Total adiposity and regional fat distribution in chronic cannabis smokers and control subjects. A: Abdominal total fat, subcutaneous fat, and visceral fat content. B: TBF (regional percent), visceral fat (percent of total abdominal fat), and hepatic fat content. Values shown are means ± SE. *P < 0.05, paired t test; ns, not significant.

