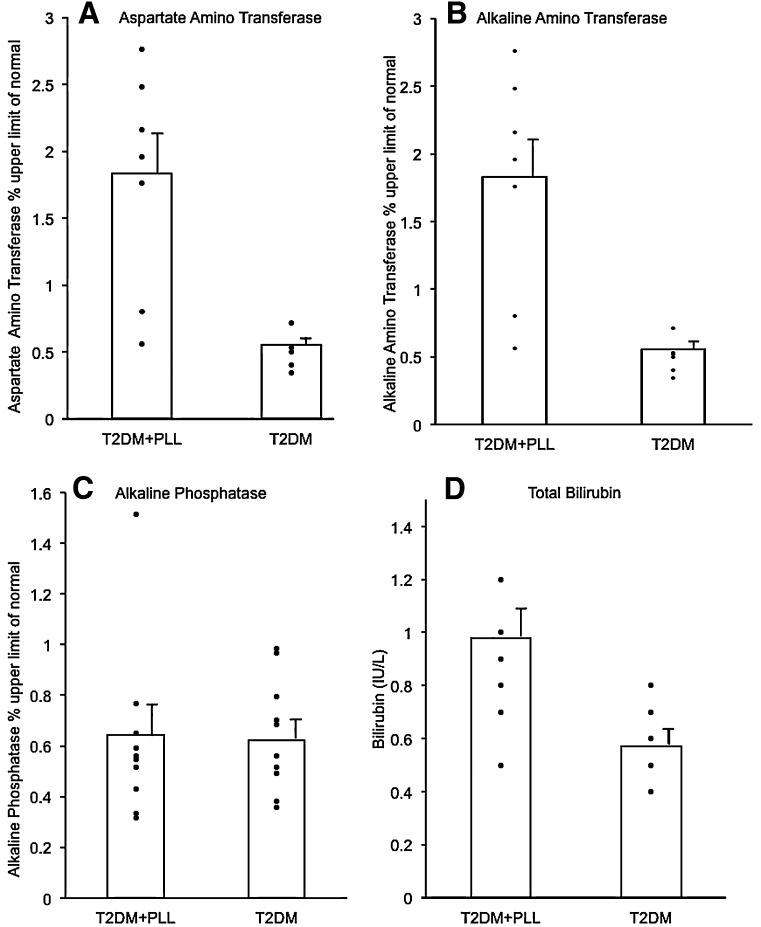
Figure 3.
Measurement of liver function. Values for AST (A), ALT (B), and ALP (C) were expressed as percentage of upper limit of the normal reference range and for total bilirubin (D) as IU/L. All panels compare mean ± SE values in patients with T2DM and PLL (T2DM+PLL) and in patients with common T2DM. The mean was statistically increased in T2DM+PLL for AST, ALT, and total bilirubin (all P < 0.05) but not for ALP (P = NS). Data in all panels were controlled for BMI, age, and race.

