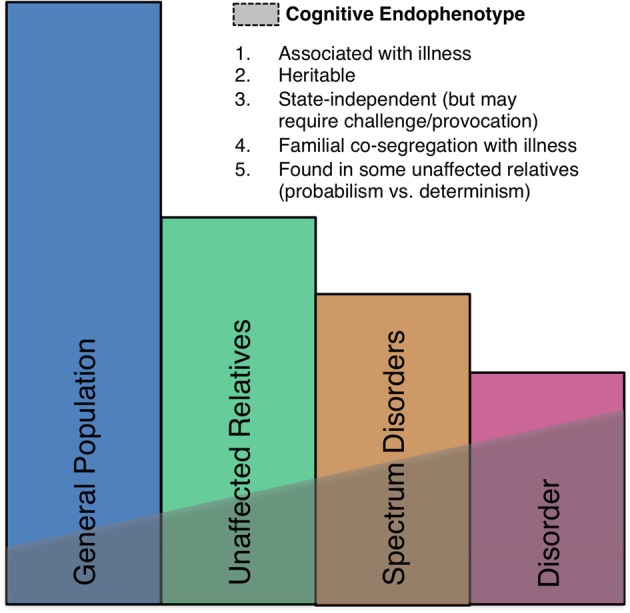
Figure 5.

A schematic illustration of the endophenotype concept. Shaded areas indicate the presence of the endophenotype in affected patients, individuals with spectrum disorders, syndromally-unaffected family members and the general population. Criteria taken from Gould and Gottesman (2006).
