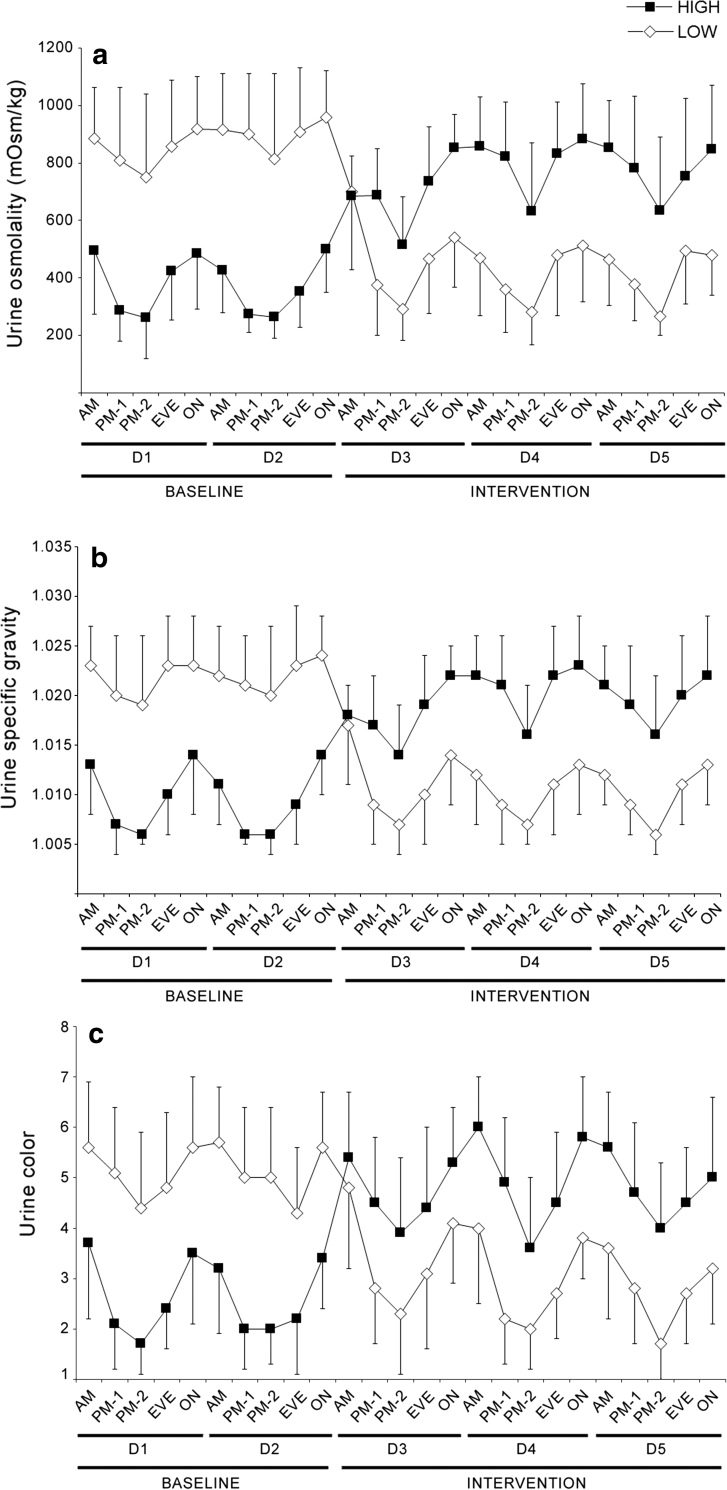
Fig. 2.
Urine osmolality (a), specific gravity (b), and color (c) measured from short urine collections during baseline (D1–D2) and intervention (D3–D5). Significant main effects of time were present for all three measures (p < 0.001 in both groups). Urinary hydration biomarkers were significantly higher during the overnight and morning collection intervals, compared with early and late afternoon. LOW low drinkers, HIGH high drinkers, AM morning, PM-1 early afternoon, PM-2 late afternoon, EVE evening, ON overnight

