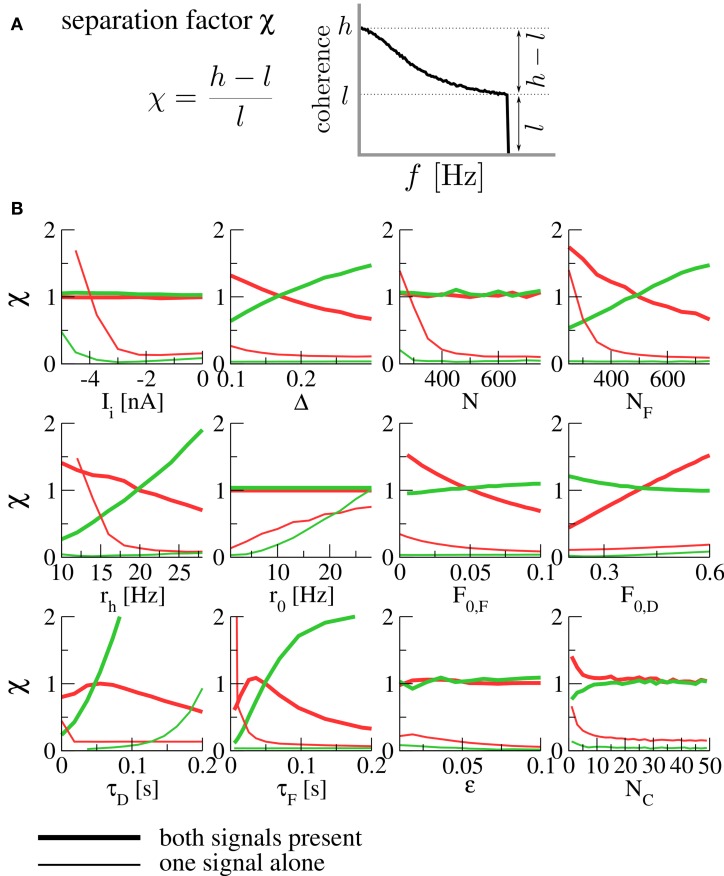
Figure 3.
(A) The separation factor as a measure for the high- or low-pass nature of the coherence. (B) Separation factors under variation of various parameters. Thick lines denote separation factors obtained when both populations are transmitting a signal, while thin lines mark the case of only one signal (with the other population firing at the background rate r0). Separation factors for the coherence between the F signal and the output spike train are plotted in red, those for the D signal in green. For all panels, the fixed parameters are those of Figure 2. N is the size of each of the presynaptic populations (meaning that both population sizes were varied at the same time), NF is the size of the F population (with the D population fixed at ND = 500), rh is the firing rate of a population transmitting a signal (meaning that both rF and rD were varied at the same time). For the simulation of varying number of functional contacts NC, the stochastic model of synaptic dynamics was used. When separation factors are low for each signal alone but high in the presence of both signals, we observe the spectral separation effect described above.

