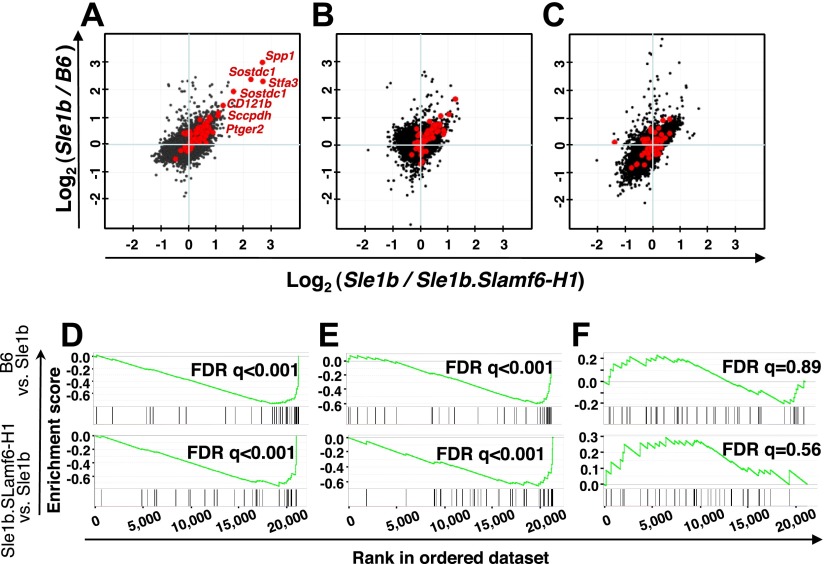
Figure 1.
Expansion of a memory CD4+ T-cell subset in Sle1b mice, but not in B6 and Sle1b.Slamf6-H1 mice, as judged by gene-expression microarray analyses. A–C) Analyses of splenic CD4+ T cells isolated by negative selection from B6, Sle1b, and Sle1b.Slamf6-H1 mice. B6, Sle1b, and Sle1b.Slamf6-H1 CD4+ T cells (12 wk old) were activated with plate-bound αCD3 (0.1 μg/ml) for 0 h (A), 4 h (B), or 24 h (C). Each dot represents a normalized gene expression ratio derived from the average of 3 microarrays (6 mice) per group. Red dots indicate genes previously found in a set of genes that were up-regulated in PD-1+ memory cells of >15-mo-old B6 mice (13). D–F) Validation of the Sle1b-specific CD4+ T-cell expression signature. Data sets were validated using GSEA (11) in the B6 vs. Sle1b (top panels) and the Sle1b.Slamf6-H1 vs. Sle1b (bottom panels) contrasts at 0, 4, and 24 h after αCD3 stimulation. Enrichment score (y axis) reflects the degree to which a gene set is overrepresented at the top or bottom of a ranked list of genes. Vertical lines below the enrichment plot indicate the position of individual PD-1+ CD4+-specific genes (13) in the rank-ordered data set. Statistical significance of the enrichment of the memory phenotype PD-1+ CD4+-specific dataset in Sle1b CD4+ T cells is estimated by false discovery rate (FDR) q value.

