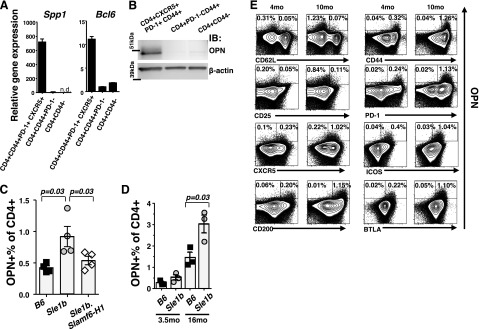
Figure 4.

Increased expression of OPN in PD-1+ CD44+ CXCR5+ TFH cells isolated from Sle1b mice, as compared to Sle1b.Slamf6-H1 and B6 mice. A) Spp1 and Bcl6 gene expression was determined by quantitative TaqMan PCR. Splenocytes from two 12-mo-old female Sle1b mice were pooled, and the 3 CD4+ T-cell subsets were isolated by FACS using antibodies as indicated. RNA was isolated and used for TaqMan PCR, as described in Materials and Methods. B) Western blot analysis with an anti-OPN antibody. Pooled splenocytes obtained from three 16-mo-old female Sle1b mice were separated by negative selection with MACS and by FACS with the indicated surface markers. C) Percentage of OPN+ cells in splenic CD4+ T cells isolated from 6-mo-old B6, Sle1b, and Sle1b.Slamf6-H1 female mice (means±se). D) Percentage of OPN+ T cells in the spleen of B6 and Sle1b female mice of the indicated ages (means±se). E) Multicolor intracellular staining of OPN in combination with the indicated surface markers using the same samples as in C. Dot plot of CD4+ OPN+ cells is overlaid on contour plots of the total CD4+ staining. Flow cytometric analyses of CD4+ T cells isolated by MACS-negative selection from 2 pooled spleens of 4- or 16-mo-old Sle1b female mice. All stainings with anti-OPN and the indicated surface markers in each group were generated from the same sample. Data are representative of 3 independent experiments.
