Figure 1.
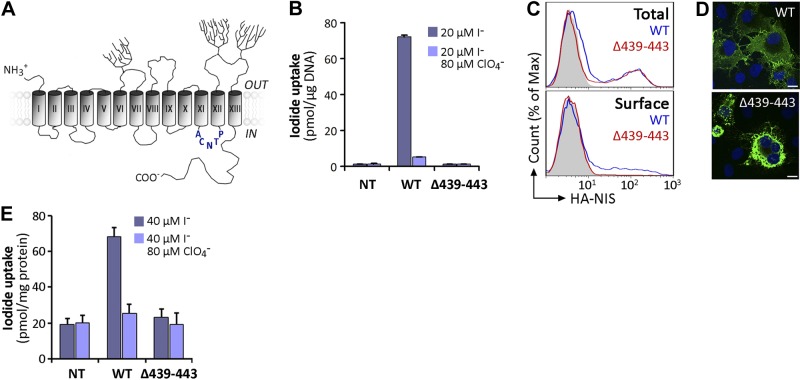
Characterization of expression and activity of Δ439–443 NIS. A) NIS secondary structure model. Cylinders represent the 13 TMS, in Roman numerals; branches indicate N-linked glycosylation sites. The amino acid sequence deleted in the ITD-causing Δ439–443 NIS mutant in IL-6 is depicted in blue. B) Steady state I− transport assays in nontransfected (Nt), wild-type (WT), or Δ439–443 NIS cDNA-transiently transfected COS-7 cells. Cells were incubated with 20 μM I− in the absence (dark bars) or presence (light bars) of 80 μM ClO4− for 45 min at 37°C, as described in Materials and Methods. Results are expressed as means ± sd (pmol I−/μg DNA). Values are representative of ≥3 different experiments; each experiment was performed in triplicate. C) Representative FACS analysis of total (top panel) and plasma membrane (bottom panel, surface) NIS expression in COS-7 cells nontransfected (solid gray) or transfected with WT (blue line) or Δ439–443 NIS (red line). Cells were stained with anti-HA Ab, followed by R-phycoerythrin-conjugated anti-rat Ab. D) Immunofluorescence analysis of permeabilized COS-7 cells expressing WT or Δ439–443 NIS. Cells were stained with anti-human NIS Ab, followed by anti-rabbit Alexa 488-conjugated Abs (green). Nuclei were stained with DAPI (blue). White scale bar: 20 μm. E) I− uptake in MVs prepared from WT or Δ439–443 NIS-expressing COS-7 cells. MVs were incubated with 40 μM I− in the absence (dark bars) or presence (light bars) of 80 μM ClO4−. Results are expressed as means ± sd (pmol I−/mg protein). The experiment shown is representative of 3 independent experiments; each experimental point was performed in triplicate.

