Figure 3.

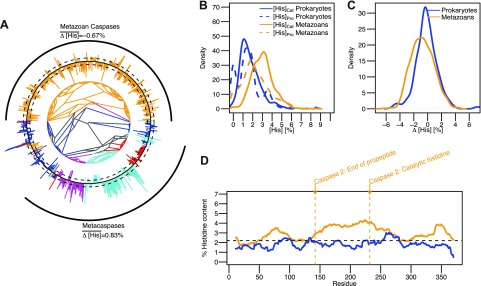
The cytosolic caspase family shows no histidine bias in propeptides. A) Phylogenetic tree of caspases from the PFAM database. Bars on the outside indicate the Δ[His] value of each sequence. Black circle represents 0%. Bars pointing outward and inward represent positive and negative Δ[His] values, respectively. Dashed circles outside and inside of the solid black circle represent Δ[His] values of ±1%. Prokaryotic, metazoan, plant, fungal, and other eukaryotic sequences are colored blue, yellow, cyan, purple, and red, respectively. Black arcs on the outside depict the metazoan caspase and metacaspase families. B) Kernel density estimation of the distribution of [His]Pro and [His]Cat in prokaryotes and metazoan is shown in blue and yellow, respectively. C) Kernel density estimation of the distribution of Δ[His] in metazoan and prokaryotic caspases is shown in yellow and blue, respectively. D) Sliding window analysis of average histidine content in metazoan and prokaryotic caspases using a window of 20 residues. Arrows indicate relative position of annotations for the end of the propeptide domain and the catalytic histidine residue according to caspase 2.
