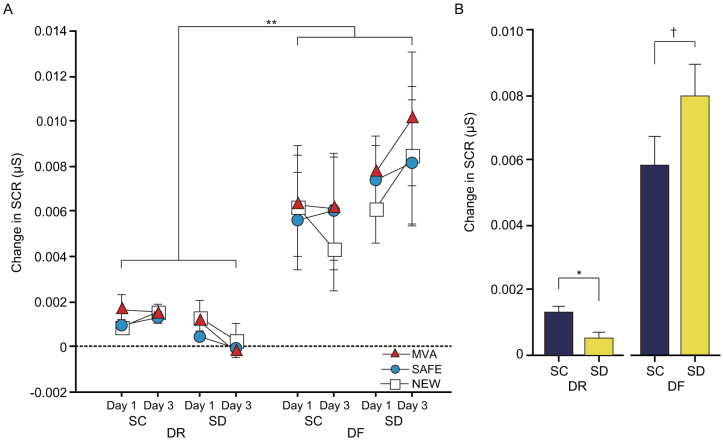
Figure 5. Factorial contribution to SCR during emotion recognition trials, and subsequent analysis of encoding × sleep interaction.
(A) Significantly enhanced SCR was observed in all contexts on Days 1 and 3 in the DF subjects compared with the DR subjects (Δ = 0.006). (B) Sleep deprivation diminished SCR in all contexts for DR subjects (Δ = − 0.001 μS) but enhanced SCR in all contexts for DF subjects (Δ = 0.002 μS). The dashed line indicates SCR at baseline. Data points (or bars) and error bars represent mean and standard error of the mean (SEM), respectively. †p < 0.1, *p < 0.001, **p < 0.0001.

