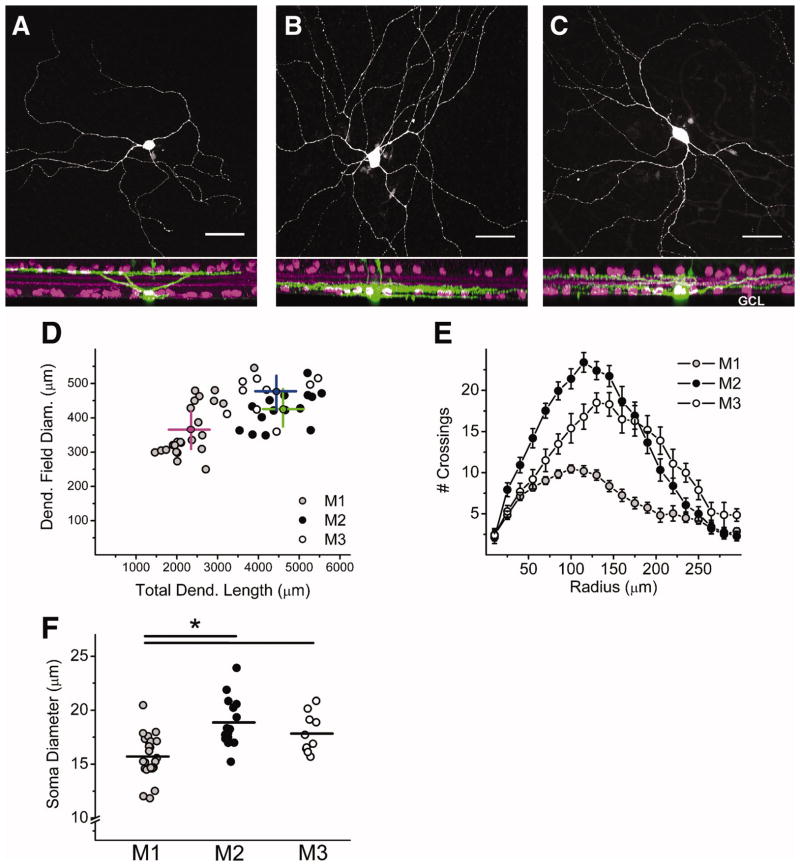
Figure 1. Morphological properties of M3 cells.
(A–C) Confocal stack in which ipRGCs have been filled with neurobiotin (green) and costained for ChAT (magenta), a cholinergic amacrine cell marker. (A) M1 cell with dendrites terminating in the outer (Off) sublamina of the inner plexiform layer (IPL). (B) M2 cell with dendrites terminating in the inner (On) sublamina of the IPL. (C) M3 cell with dendrites terminating in the inner (On) and outer (Off) sublaminas of the IPL. Note: processes visible extending through IPL in A–C are those of Müller cells, which often take up dye during the patching procedure. (D) Plot showing total dendritic length (μm, x-axis) and dendritic field diameter (μm, y-axis) of M1 (gray circles), M2 (black circles), and M3 (open circles). Magenta (M1), green (M2), and blue (M3) lines represent the mean value for each cell type. (E) Sholl analysis (15 μm steps from starting diameter of 10 μm) of M1 (gray circles), M2 (black circles), and M3 (open circles) dendritic arbors. (F) Soma diameter (μm) of M1 (gray circles), M2 (black circles), and M3 (open circles) cells. Lines represent mean values. Scale bar (A–C): 50 μm. *p<0.05 ANOVA. INL, Inner Nucelar Layer, GCL, Ganglion Cell Layer.

