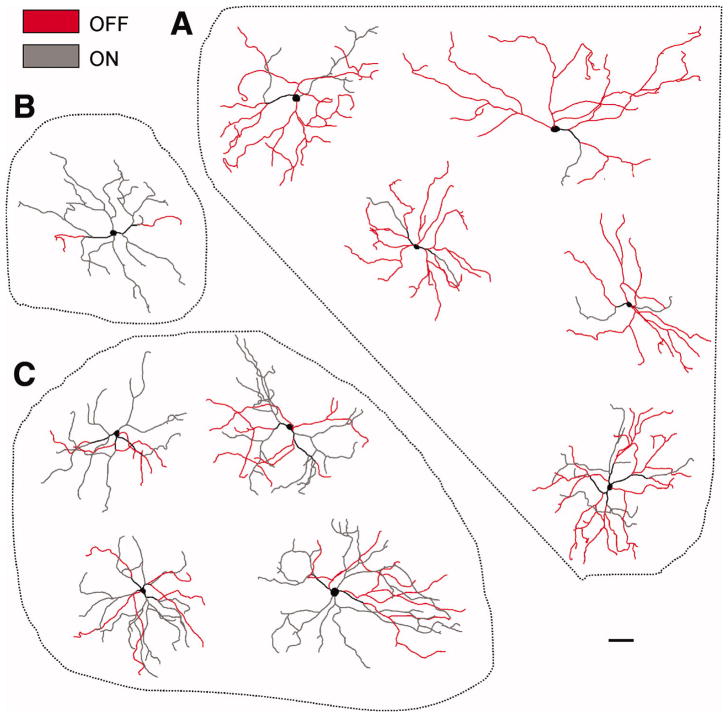
Figure 2. Dendritic arbors of M3 cells.
Traced dendritic arbors of neurobiotin or LY-filled M3 cells. Red-colored arbors represent those dendrites terminating in the Off sublamina of inner plexiform layer. Gray colored processes represent dendrites terminating in the On sublamina. (A) M3 cells with dendrites confined mainly to the Off sublamina. (B) M3 cell with dendrites confined mainly to the On sublamina (C) M3 cells with substantial dendritic stratification in both the On and Off sublaminas. LY: Lucifer yellow. Scale bar: 100 μm.

