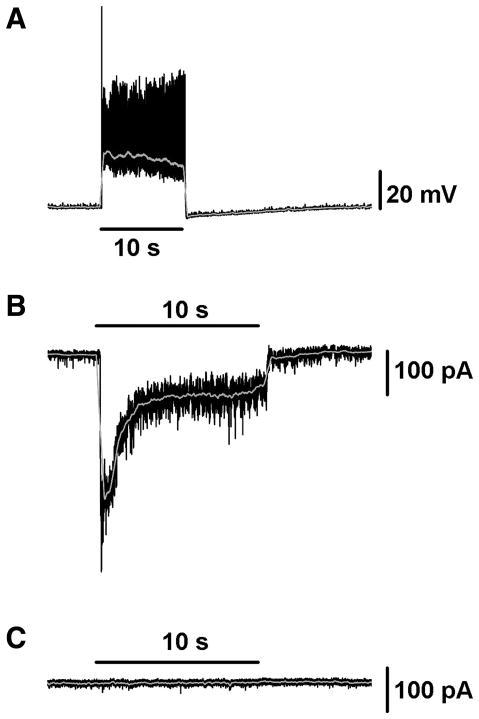
Figure 7. Synaptic input to M3 cells recorded in Opn4−/− mice.
(A) Current clamp recording of M3 cell light response to 10 s full-field, bright, white light stimulus in Opn4−/− mouse. (B–C) Voltage clamp recording of M3 cell light response to 10 s full field, bright, white light stimulus in Opn4−/− mouse first in control conditions (B) and then in the presence of 100 μM L-AP4 (C). In the presence of L-AP4 the light response of this cell is completely abolished. Gray lines (A–C, E) represent 0.1 s smoothing of membrane voltage.

