
Figure 2.
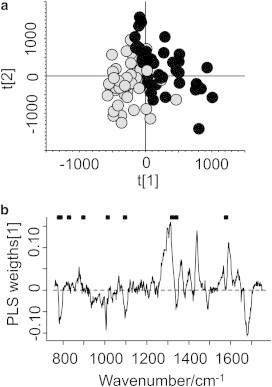
(a) Score plot for the first two PLS components in the PLS-DA model. Grey dots: observations from the cell nucleus. Black dots: observations from outside the cell nucleus. (b) PLS weights for the first PLS component. The positions of Raman bands assigned to DNA are marked by dots.