
Figure 7.
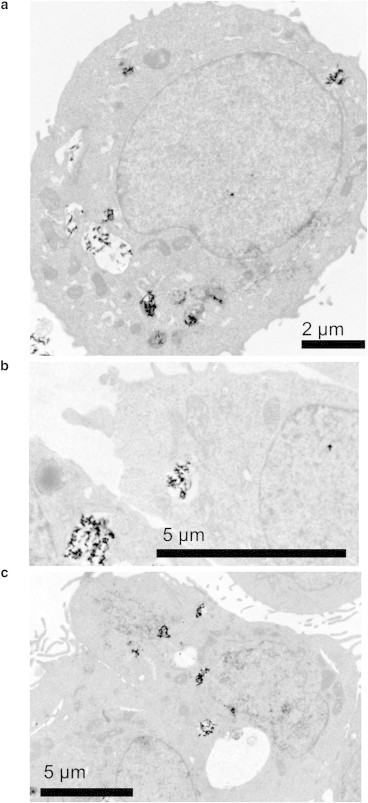
TEM images of sections of A549 cells exposed to (a) 10 μg ml−1α-FeO(OH) nanoparticles, (b) 10 μg ml−1 TiO2 nanoparticles, or (c) 10 μg ml−1 of α-FeO(OH) and 10 μg ml−1 TiO2 nanoparticles.
Official websites use .gov
A
.gov website belongs to an official
government organization in the United States.
Secure .gov websites use HTTPS
A lock (
) or https:// means you've safely
connected to the .gov website. Share sensitive
information only on official, secure websites.
TEM images of sections of A549 cells exposed to (a) 10 μg ml−1α-FeO(OH) nanoparticles, (b) 10 μg ml−1 TiO2 nanoparticles, or (c) 10 μg ml−1 of α-FeO(OH) and 10 μg ml−1 TiO2 nanoparticles.