Figure 1.
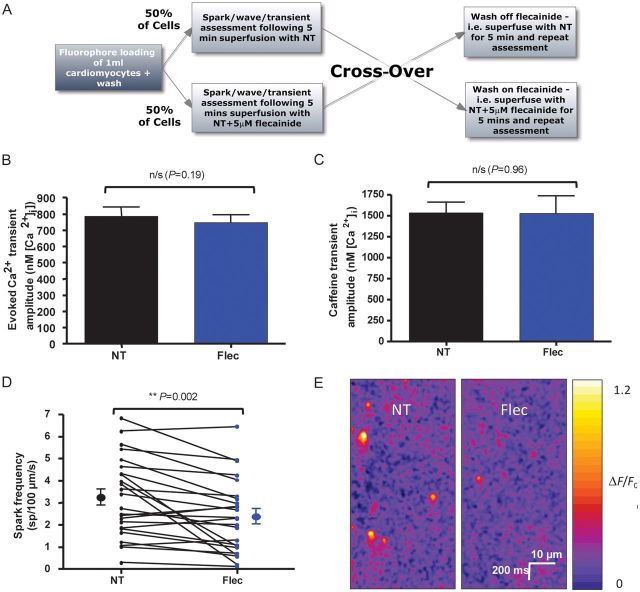
Experimental protocol and effects of flecainide on Ca2+ transients and Ca2+ sparks. (A) Experimental flowchart to explain cross-over protocol used in experiments. Fifty per cent of cells had NT applied first with drug wash-on, whereas 50% had drug applied first and subsequently washed-off. (B) Stimulated Ca2+ transients were assessed using the ratiometric dye fura-2 calibrated to give [Ca2+]i. Transient amplitude was not changed in the presence of 5 μM flecainide (n = 30 cells, P = 0.19). (C) 20 mM caffeine in 0Na+/0Ca2+ solution was used to assess SR Ca2+ load following a 5 Hz contraction train. The amplitude was unchanged in the presence of 5 µM flecainide (n = 13 cells in each group, P = 0.96 by Student's t-test). (D) Spark frequency was reduced following flecainide application (n = 24 cells, P = 0.002). (E) Representative line-scans showing a reduction in spark frequency with flecainide. The same cell is shown before and after flecainide application.

