Figure 5.
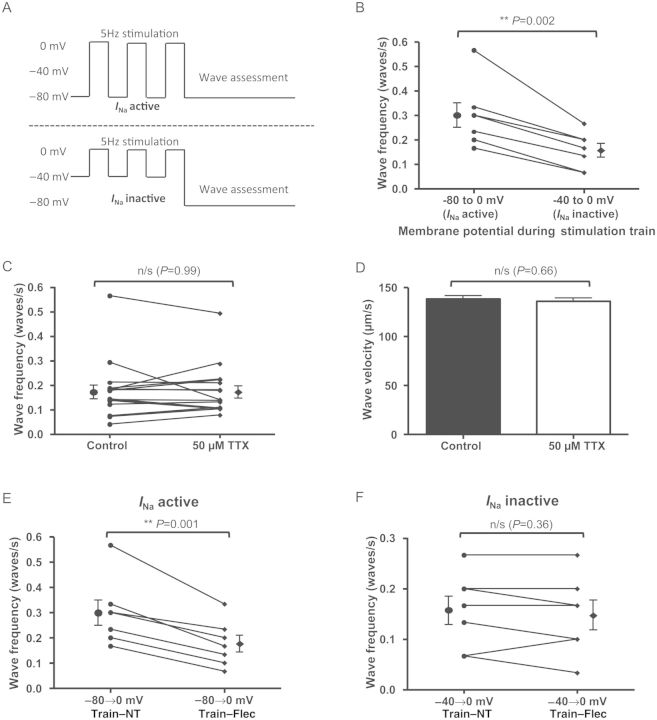
Elucidation of Mechanism A as most likely cause for reduction in Ca2+ waves due to INa blockade. (A) Voltage clamp stimulation trains used to assess wave frequency with and without INa activity. Stimulation was induced by stepping from −80 to 0 mv (INa active) or −40 to 0 mV (INa inactive). Pulse duration was 100 ms and pulses were applied at 5 Hz. Waves were assessed in a subsequent 30 s interval during which membrane potential was held at −80 mV. (B) With INa inactive during the stimulation train (but available during the quiescent phase of the experiment), wave frequency was reduced (P = 0.002, n = 7 cells). (C) High-dose (50 µM) TTX was rapidly applied to cells to terminate stimulation following a period of external field stimulation at 5 Hz and compared with the control arm in which stimulation was terminated in the usual fashion at 30 s (see Supplementary material online, Figure S4 for further explanation). This produced the opposite situation to the previous experiment with INa active during the stimulation train but Nav1.5 channels unavailable for stimulation during the quiescent phase. This produced no change in wave frequency (P = 0.99, n = 17 cells). (D) Similarly, there was no change in wave velocity (P = 0.66 by Student's t-test. Control: n = 88 waves; 50 µM TTX: n = 89 waves from 17 cells). (E) Voltage clamp experiments showing effects of flecainide on wave frequency with INa active vs. inactive. With INa active, flecainide reduces wave frequency (P = 0.001, n = 7 cells). (F) However, with INa inactive, no reduction in wave frequency was observed (P = 0.36, n = 7 cells).

