
Figure 6.
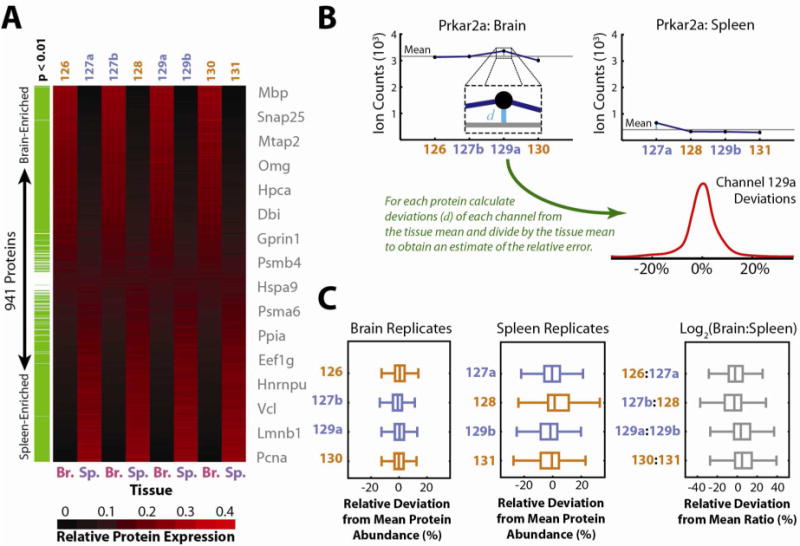
(A) Quadruplicate mouse brain and spleen samples were labeled and the combined lysates were analyzed in a single LC-MS run to evaluate the performance of isobaric labeling for quantitative characterization at a proteomic scale. Relative reporter ion intensities are displayed as a heat map for 941 quantified proteins, ordered by their relative expression in brain (Br.) versus spleen (Sp.). Differentially expressed proteins were identified by Welsh’s T-Test (p < 0.01) with multiple testing correction by the method of Benjamini and Hochberg38 and are highlighted in green. Gene symbols from representative proteins are listed near their expression profiles. Reporter ion channels with standard spacing are colored orange, while isobaric channels are highlighted in blue. Notably, protein expression profiles are indistinguishable for brain and spleen replicates with either standard or isobaric labels. (B) To further probe the effects of isobaric labeling, each protein’s abundance profile was analyzed as depicted for Prkar2a. For each protein the mean ion count within each tissue was subtracted from each observed reporter ion count and the resulting difference was divided by the tissue mean. The resulting relative deviations were tallied for each reporter ion across all quantified proteins and the resulting distributions (C) were plotted as Box-Whisker plots for comparison. Similarly, relative deviations of log2 ratios observed for pairs of brain and spleen replicates compared with the overall average log2 ratio were plotted. If present, sub-optimal quantitation via isobaric labeling would be apparent either due to systematic shifts away from the mean (zero) or due to overall wider scatter in these distributions. However, no systematic differences between standard and isobaric labels are apparent, suggesting equivalent quantitative performance.