
Figure 1.
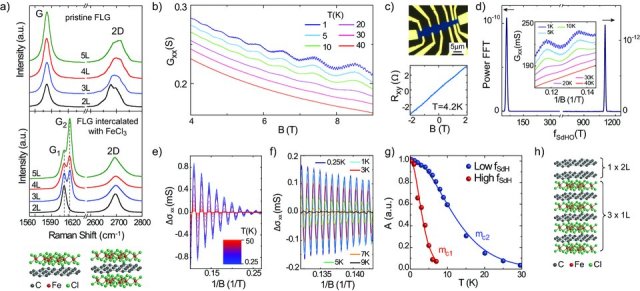
a) The G and 2D Raman bands of pristine FLG (top) and of FeCl3-FLG (bottom) with different thicknesses ranging from 2L to 5L. The Raman shift of G to G1 and G2 stem for a graphene sheet with one or two adjacent FeCl3 layers as shown by the schematic crystal structure. b) Longitudinal conductance (Gxx) as a function of magnetic field at different temperatures (curves shifted for clarity). c) Top panel: false color optical microscope image of an intercalated Hall bar device. Bottom panel: Hall resistance (Rxy) as function of magnetic field. d) Fourier transform of Gxx(1/B) with peaks at frequencies fSdHO1 = 1100T and fSdHO2 = 55T. The inset shows Gxx as a function of inverse magnetic field at different temperatures (curves shifted for clarity). Panels e) and f), respectively, show the low- and high- frequency magneto-conductivity oscillations vs 1/B extracted from the measurements in b) (see Experimental section). g) Temperature decay of the amplitude (A) of Δσxx oscillations at B = 6.2T. The amplitudes are normalized to their values at T = 0.25K. The continuous lines are fits to A(T)/A(0.25) with the cyclotron mass mc as the only fitting parameter. h) Schematic crystal structure of a 5L FeCl3-FLG in which electrical transport takes place through four parallel conductive planes, one with bilayer character and three with monolayer character.