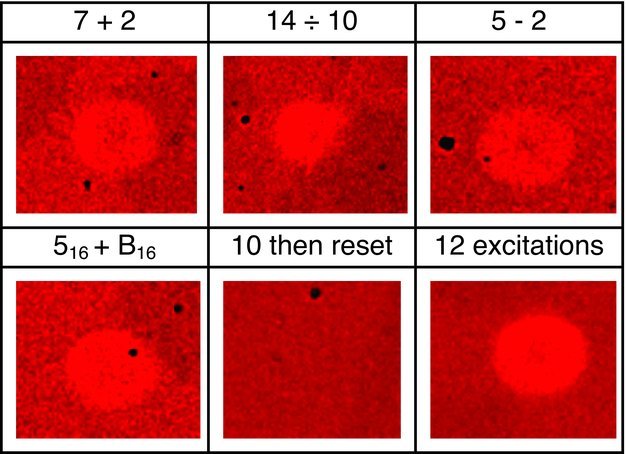
Figure 3.

Simultaneous phase-change processing and storage. Microscope images (50 μm × 42 μm in each case) of marks in the Ge2Sb2Te5 sample after the execution of various arithmetic processes. From left to right the first three images show the mark after computing and extracting the result for the base-10 computation of 7 + 2, 14÷10 and 5–2. The fourth image shows the mark after computing and extracting the result of the base-16 addition 516+B16. For the first two calculations a single excitation comprised a group of 25 × 85 fs optical pulses; for the subtraction calculation a single excitation comprised 50 × 85 fs pulses; for the base-16 calculation a single excitation was 16 × 85 fs pulses. The extraction of the stored result for each of these computations took the measured reflectivity change above the pre-determined threshold value (which was 5%, 5%, 4.5% and 5.4% respectively), so the final marks in each case look very similar. In normal operation the phase-change material is reset to its initial state whenever the threshold is exceeded; in our case this was carried out using a single 11.7 mJ/cm2 85 fs pulse that successfully reset the system to the amorphous phase, as can be seen in the fifth image from the left which shows the result of inputting 10 (25 × 85 fs, 3.61 mJ/cm2) excitations followed by a single 11.7 mJ/cm2 85 fs reset pulse. Also shown (far right image) for comparison purposes is the resulting mark after 12 excitations and without resetting; in this case the reflectivity change is ∼11% and the mark is clearly different, even to the eye.
