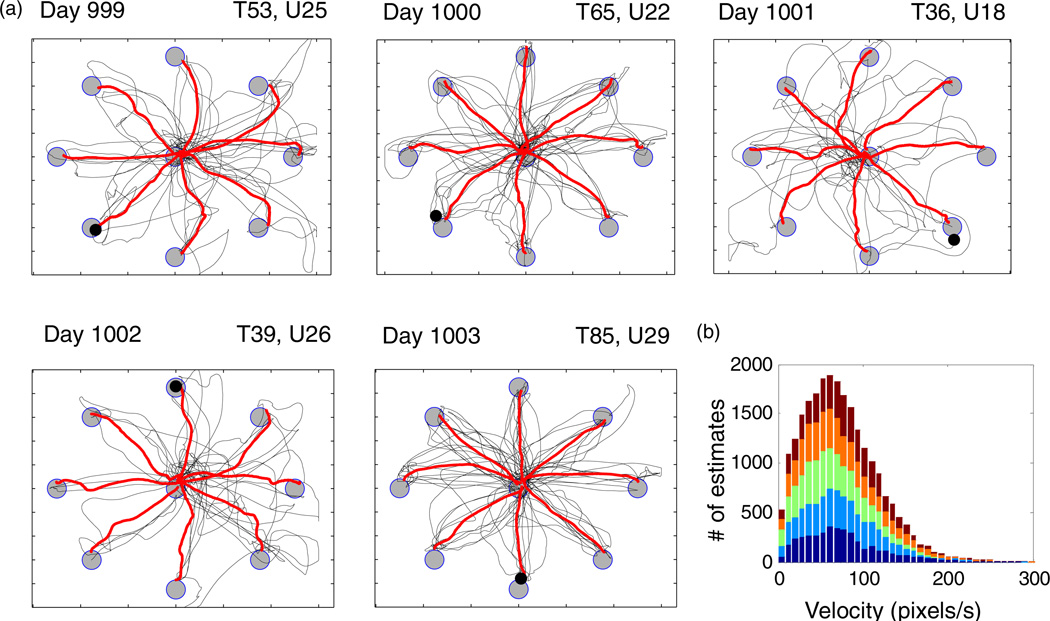
Figure 3.
Neural cursor kinematics for trials in the Radial-8 task on five consecutive days. (a) Trajectories for all correct center-to-peripheral and peripheral-to-center movements (thin lines) with mean trajectories (thick lines). Gray circles (targets) and black circle (neural cursor) are drawn to scale with the outlining box demarcating display screen limits. All correct trials (‘T’) are shown for each day and span 10 min except Day 999 which was terminated at 9 min. ‘U’ indicates the number of units in the decoding filter. (b) Histogram of Radial-8 cursor speeds computed from the decoded velocity estimate at every time step (bin = 6 pix s−1; 26 689 samples) in the Radial-8 task. Each colour shows the distribution from one of the five days.

