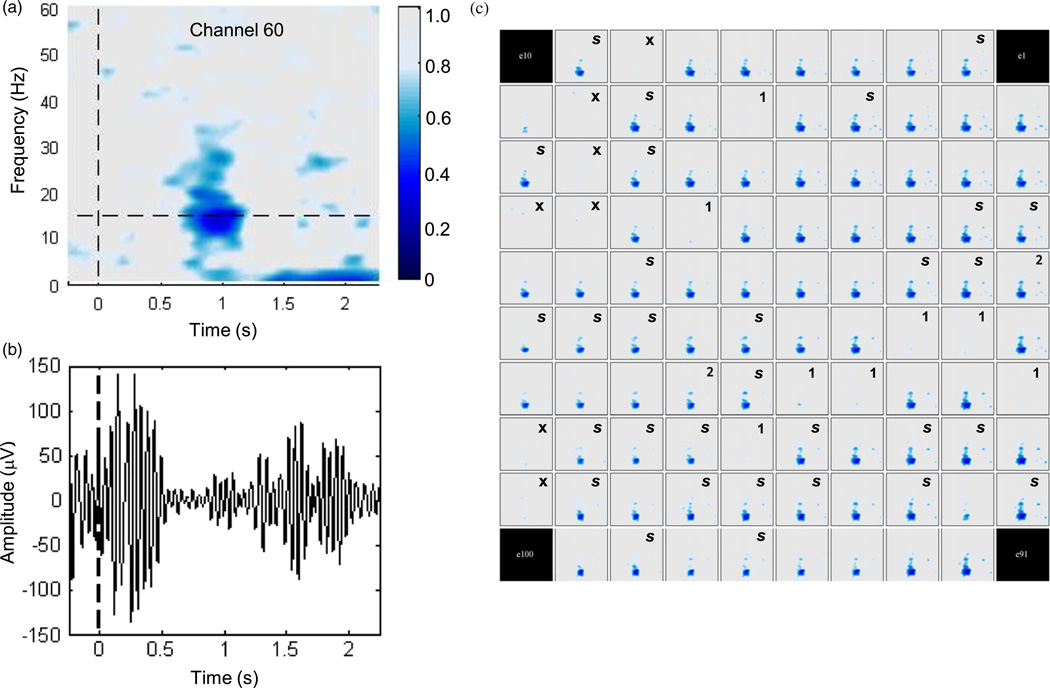
Figure 7.
Changes in the spectral content of local field potentials associated with intended movement on Day 1000. (a) Trial-aligned mean spectrogram of the field potential recorded from one representative electrode during 10 min of the Radial-8 task. Time 0 indicates time of target presentation. Changes in power, relative to within-band power before target appearance, were computed in 1 Hz steps using overlapping windows. Colour indicates proportion of amplitude change for each frequency relative to pre-presentation baseline. Dark blue reveals suppression between 14~30 Hz evident 0.6~ 1.2after target appearncn Horizontal line marks the frequency exhibiting maximum suppression (15 Hz). (b) Single-trial field potential from the same electrode as in (a) aligned to target appearance (t= 0) and filtered (10–20 Hz, 8th order filter) to highlight changes in signal amplitude corresponding to the power suppression near 15 Hz. (c) Spectrograms as in (a) computed for each of 96 electrodes during the Radial-8 task (excluding frequencies below 2 Hz for clarity). Notations: (s) 30 electrodes with sorted units on this day, (x) seven putative failed electrodes with impedances ≫ 4 MΩ on all five days, (1) additional 8 electrodes with impedance > > 4 MΩ on this particular day, (2) 2 electrodes with impedance ~4 MΩ. Colour range identical to (a).

