
Figure 2.
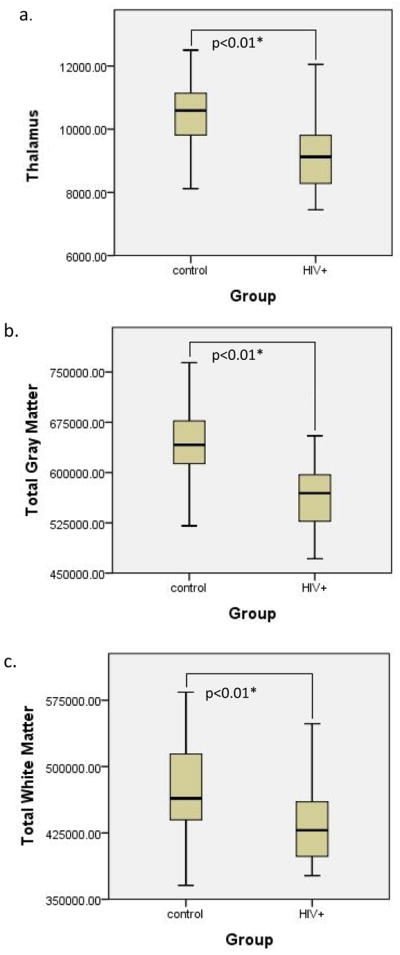
Boxplots of the volumes for each group with significant group differences noted. The dark lines in the boxes represent the mean values for the volumes of the groups (HIV+ and controls) in each region a) Total Thalamus (p<0.01) b) Total Gray Matter (p<0.01) c) Total White Matter (p<.01)