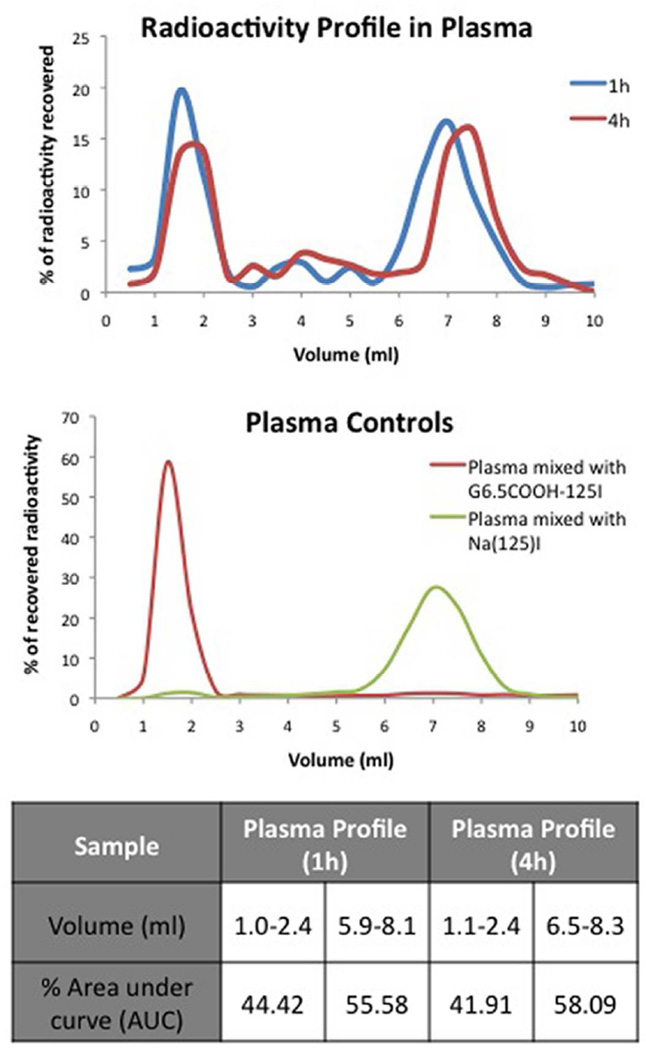
Figure 5.
A) Radioactivity profile in plasma of CD-1 mice after oral administration of G6.5-COOH as analyzed by size exclusion chromatography. Results indicate presence of large molecular weight fractions corresponding to dendrimers in plasma at 1h and 4h as well as presence of small molecular weight radioactive fractions. B) Panel indicates control graphs of small molecular weight impurities and macromolecules mixed externally with mice serum to validate the size exclusion method. Table indicates the % area under the curve (AUC) for the peaks.

