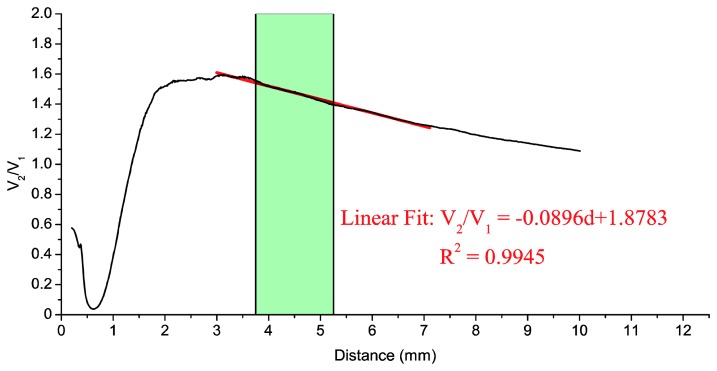
Figure 6.
Calibration curve of the optical fiber sensor: quotient of photodetector voltages (V2/V1) as a function of the blade distance (d). The red line represents the fit to the calibration curve of a straight line in the range 3–7 mm. The shaded area corresponds to usual values of the TC (without correction).

