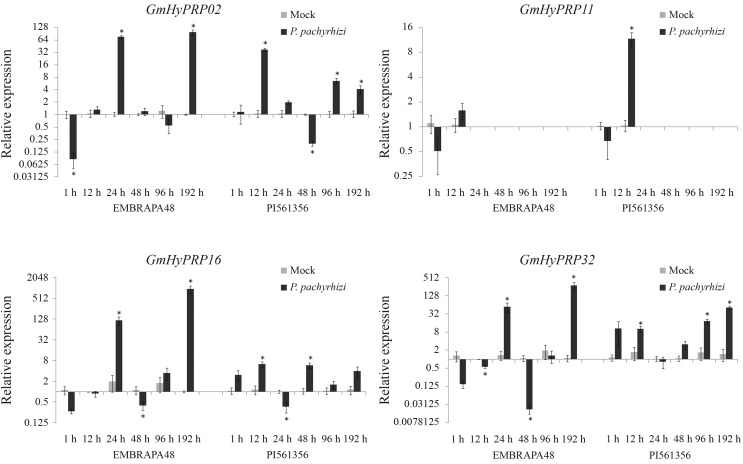
Figure 4.
Expression profile of four soybean HyPRP-encoding genes in response to infection by Phakopsora pachyrhizi in the highly susceptible genotype Embrapa-48 and in the resistant genotype PI561356. Expression was assessed by real time RT-qPCR and is shown relative to the levels of F-box and metalloprotease. The columns are the mean of three biological samples (pool of three plants each sample). Y bar indicates the standard error of the mean. Asterisk (*) indicates p < 0.05 compared to mock.

