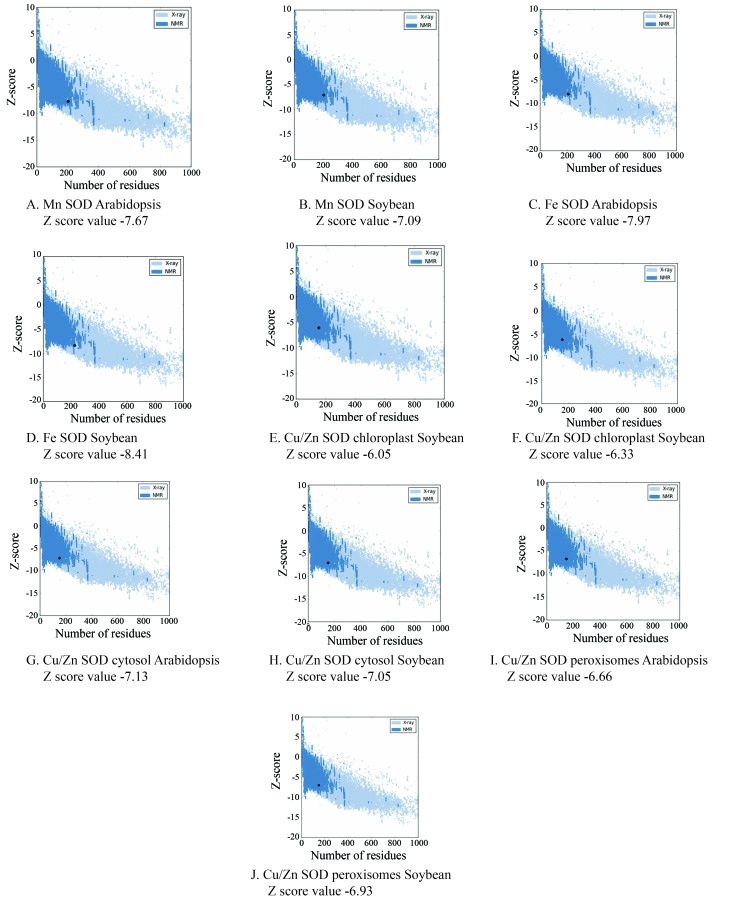
Figure 5.
ProSA-web z-score chimeric protein plot. The z-score indicates overall model quality. The ProSA-web z-scores of all protein chains in PDB were determined by X-ray crystallography (light blue) or NMR spectroscopy (dark blue) with respect to their length. The plot shows results with a z-score ≤ 10. The z-score for SOD is highlighted as a large dot. The value is within the range of native conformations.

