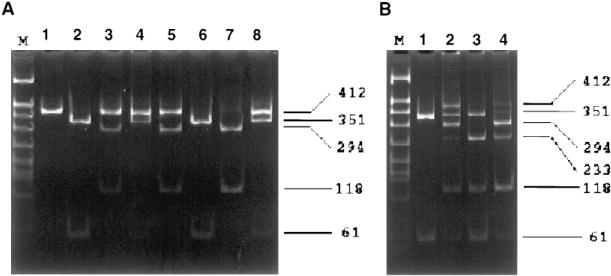
Fig. 2.

RFLP analysis of CYP2E1 Rsal/Pstl genotypes. Representative CYP2E1 PCR-RFLP analysis using purified buccal cell DNA from four study subjects. Twenty percent of each PCR, digested with RsaI and/or PstI, was electrophoresed on an 8% Polyacrylamide gel, stained with ethidium bromide, and photographed over UV light. Panel A, PCR-RFLP analysis performed by digesting CYP2E1 PCR product with RsaI or PstI in individual digestion reactions. Lane M: DNA marker; lanes 1,3,5,7: PstI-digested products; lanes 2,4,6,8: RsaI/-digested products. Panel B, CYP2E1 PCR-RFLP analysis performed using combined digestion with RsaI and PstI in the same digestion reaction. Lane M: DNA marker; lanes 1–4: RsaI/PstI-digested products. Numbers on right indicate PstI/RsaI-digested CYP2E1 PCR-RFLP band sizes.
