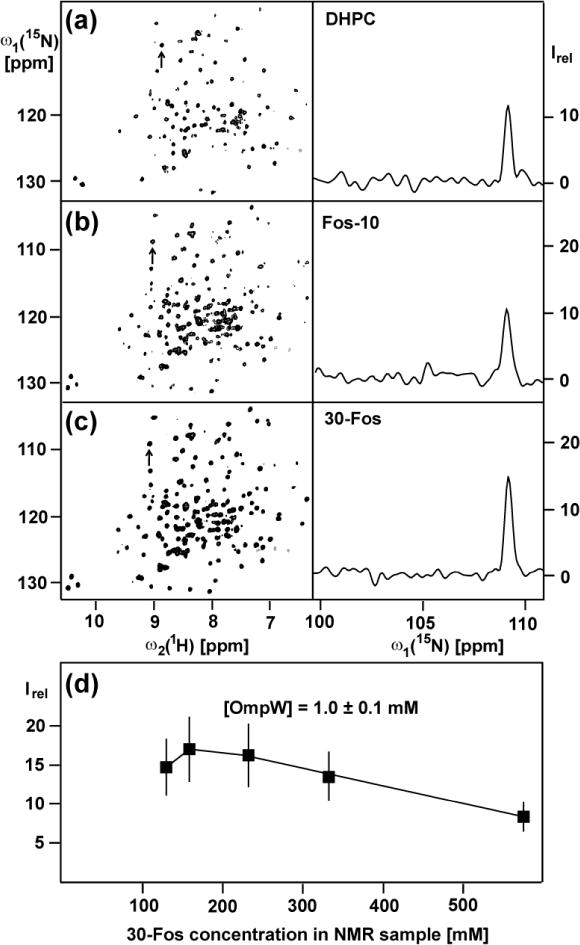
Fig. 1.

700 MHz 2D [15N,1H]-TROSY correlation NMR spectra of [2H,15N]-labeled OmpW solubilized at 1 mM concentration in 230 mM aqueous solutions of three different detergents at 298 K. (a) DHPC. (b) Fos-10. (c) 30-Fos. For each detergent the left panel shows a contour plot of the 15N–1H correlation peaks, and the right panel displays a cross section along ω1 (15N) of the peak identified with an arrow in the left panel. (d) Plot of the mean intensity of the cross-peaks in the 2D [15N,1H]-TROSY spectra of [2H,15N]-labeled OmpW reconstituted in 30-Fos micelles, Irel, versus the 30-Fos concentration. The error bars represent the standard deviation to the mean taken over all the 15N–1H cross peaks. The following acquisition and processing parameters were used to record the 2D [15N,1H]-TROSY spectra with a 1.7 mm microcoil probehead: data size 100 (t1) × 1024 (t2) complex points; t1max = 35.24 ms; t2max = 86.11 ms; 128 scans per t1 increment; overall measurement time 8 h per experiment. Before Fourier transformation the data matrices were multiplied with an exponential window function in the acquisition dimension, and with a 75º-shifted sine bell window (DeMarco and Wüthrich 1976) in the indirect dimension.
