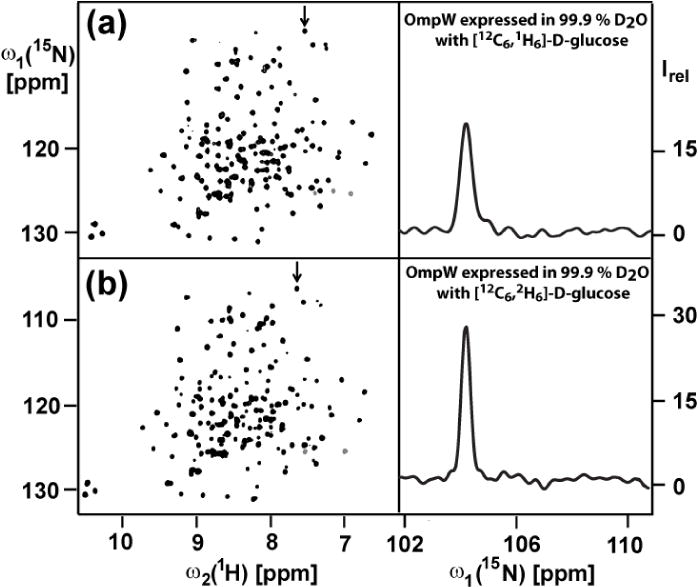
Fig. 3.

Effect of variable 2H-labeling levels on the 2D [15N,1H]-TROSY spectra at 298 K of 1 mM [2H,15N]-labeled OmpW reconstituted in aqueous solution containing 230 mM 30-Fos. Same presentation as in Figures 1, a–c and 2. (a) Protein expressed with protonated glucose. (b) Protein expressed with deuterated glucose. The same acquisition and processing parameters were used as in Fig. 1, except that 256 scans per t1 increment were accumulated and the overall measurement time per experiment was 16 h.
