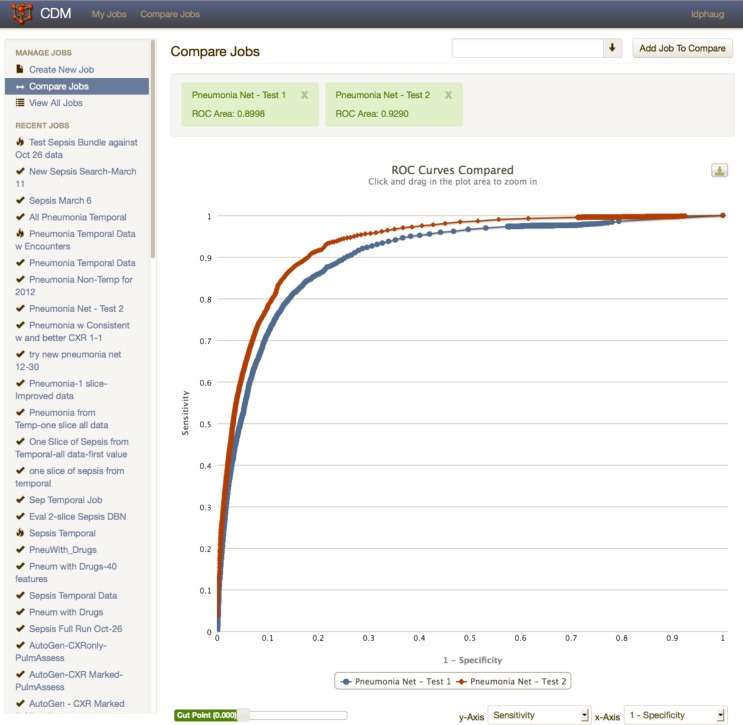
Figure 5.
Graphics produced by the analytic workbench. Receiver operating characteristics (ROC) curves for two different models produced during the study of a pneumonia diagnostic model are displayed. The area under the ROC curve is a good overall measure of the accuracy of a diagnostic predictive model.

