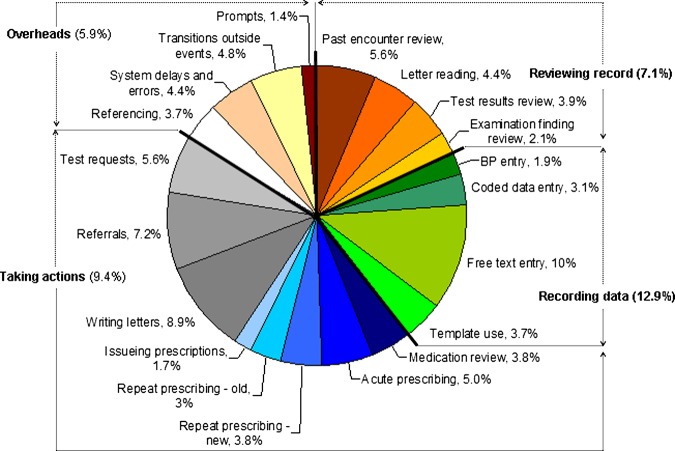
Figure 5.
Distribution of mean computer use durations associated with common consultation tasks, shown as proportions of the greater consultation duration, based on the number of actual consultations they were observed in; for example, when a clinician was observed entering free text data they did so spending a mean duration of 10.0% of the consultation duration. Note: the percentage values shown are based on the actual number of consultations in which the particular task was observed, and since not all tasks took place in every consultation, the sum of proportions is less than 100%; approximate proportionate values are used to draw the pie chart. This figure is only reproduced in colour in the online version.

