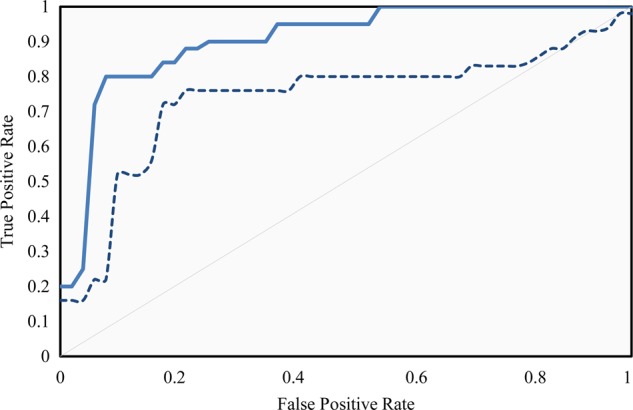
Figure 3.

Receiver operating characteristic (ROC) curves. Continuous line: ROC curve calculated using training data. Dashed line: ROC curve calculated using test set. The area under the curve was 0.90 for the training set and 0.76 for the test set. The operating point was selected to maximize the specificity and sensitivity pair in the training set.
