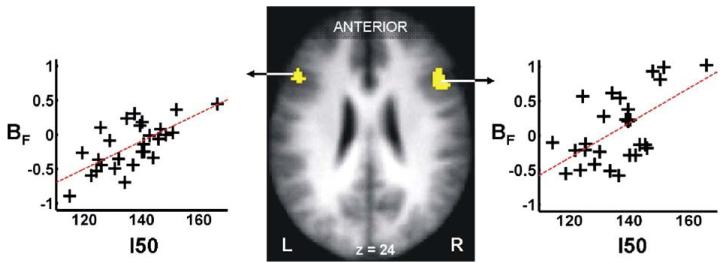
Fig. 3.
The effect of stimulus–output characteristics of left sensorimotor cortex I50 (where I50 represents the TMS stimulation intensity required to get a response 50% of the maximum motor evoked potential in the right first dorsal intersosseus muscle), on force modulation properties BF (where BF represents the partial correlation coefficient between BOLD signal and right hand grip force) in the ventral premotor cortices bilaterally. The significant voxels (P<0.05, corrected) are overlaid onto the mean normalised T1-weighted structural image obtained from all subjects. Peak coordinates, Z-scores and correlation coefficients are given in Table 6.

