Figure 1.

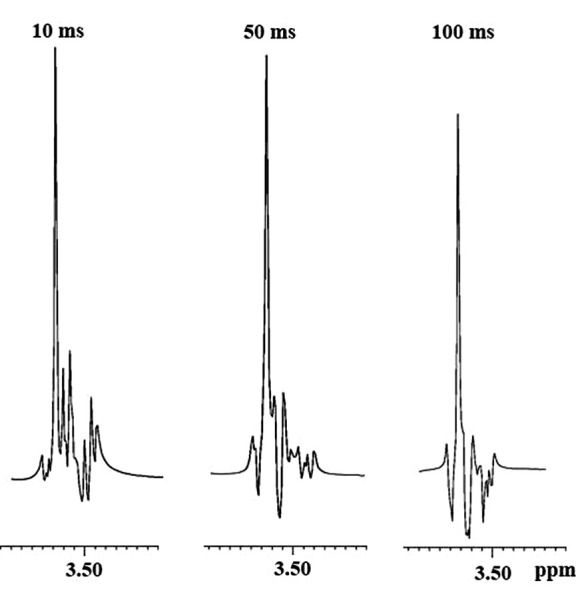
Simulated spectra of Gly (3.55 ppm) and Myo (3.53 ppm M2 H) under single spin-echo excitation. From left to right: simulated spectral line shape at TEs of 10, 50 and 100 ms. Spectra were simulated in the XWINNMR software environment.

Simulated spectra of Gly (3.55 ppm) and Myo (3.53 ppm M2 H) under single spin-echo excitation. From left to right: simulated spectral line shape at TEs of 10, 50 and 100 ms. Spectra were simulated in the XWINNMR software environment.