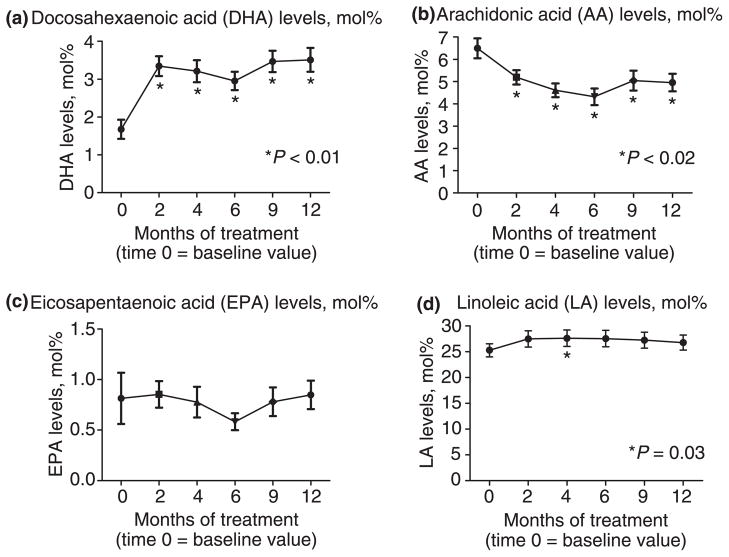
Figure 3.
Baseline and subsequent serum levels, expressed as mol%, of select fatty acids over the course of treatment for BIDMC subjects only. At the 2 month follow-up visit, DHA is significantly higher, while, AA is lower compared to baseline. No changes are observed at 12 months compared to baseline for EPA and LA.

