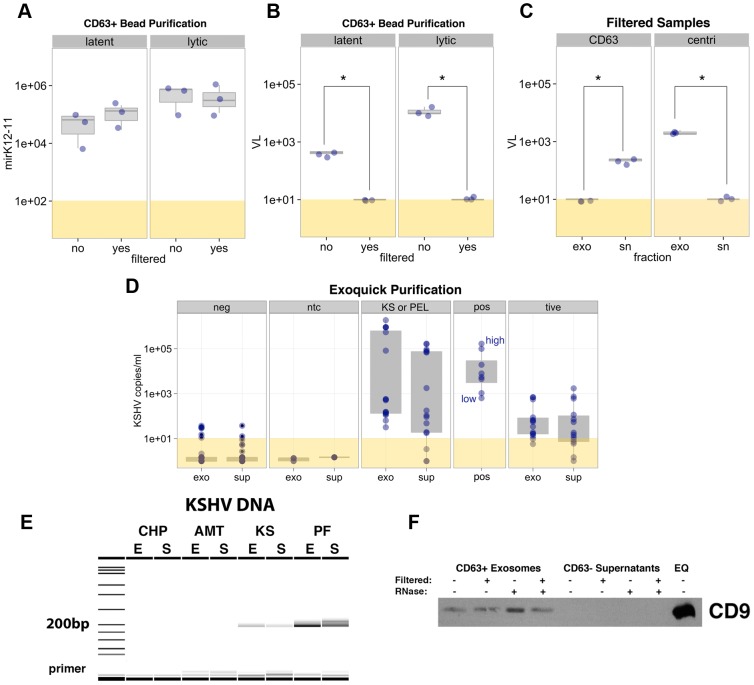
Figure 3. Analysis of KSHV miRNA expression and viral DNA in exosome samples.
Box plot representation of miR-K12-11 expression (A) and KSHV load (B) in latent and lytic exosomes purified using the CD63+ Dynabeads method. Sample filtration is noted below each plot. MiRNA expression is shown as fold above background and viral load data is shown as copy number of LANA DNA per reaction. (C) Box plot of viral load for filtered samples purified using either CD63 (left panel) or differential ultracentrifugation (centri, right panel). Viral load is shown for both exosome (exo) and supernatant (sn) fractions. Asterisks denote significance of p≤0.05. (D, E) KSHV viral load from ExoQuick samples was determined by qPCR (D) and products were run on the Caliper LabChip GX (E). (D) Sample groups are as follows: neg (control human and mouse samples negative for KSHV), ntc (no template control), KS or PEL (KS patients and primary PEL fluid), pos (dilutions of oligonucleotide positive controls; high to low concentrations) and tive (xenograft mouse models of KS). (E) Sample abbreviations are as follows: KS = plasma from KS, AMT = AIDS Malignancy, non-KS, PF = pleural fluid, CHP = control human plasma, E = exosome fraction, S = exosome-depleted supernatant fraction. (F) Western blot for the exosomal marker CD9. Samples were enriched for exosomes using CD63+ Dynabeads and were filtered prior to bead purification as noted. Resulting CD63+ and CD63− fractions were treated with RNase as denoted and protein lysates were evaluated. As a positive control, a lysate of pleural fluid-derived exosomes using the ExoQuick (EQ) method were assessed for CD9 expression.

