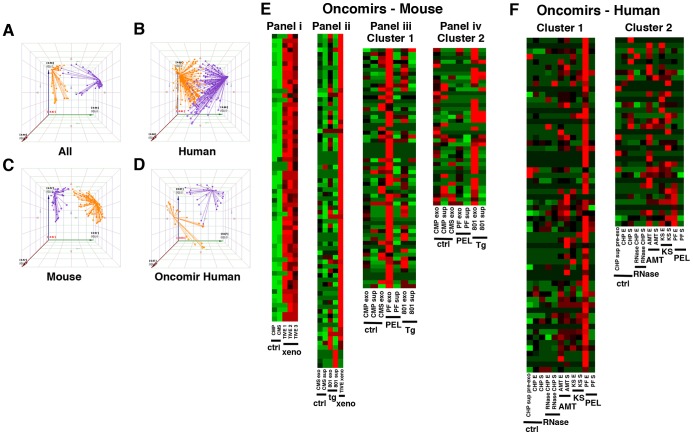
Figure 4. miRNA profiling reveals distinct oncomiR and exosome subsets.
Profiling of miRNAs led to the discovery of distinct signatures for oncomiRs and exosome subsets. Cluster separation of miRNA expression by principal component analysis (PCA) of (A) all miRNAs profiled, (B) human samples, (C) mouse samples and (D) oncogenic miRNAs in human samples. MiRNAs were clustered by their levels of expression to reveal two distinct clusters of expression patterns: one with generally high expression in KS and PEL samples (purple, cluster 1) and one with high expression in another subset of samples specific to a control, malignancy or exosome-specific (shown in yellow, cluster 2). Each solid circle represents one microRNA and lines are drawn from each point to the centroid or mean position of points in a given cluster. This centralized point allows for the largest difference between clusters and minimizes the distance of points within a given cluster to the centroid. Heatmaps reflective of unsupervised clustering analysis are shown for oncomirs in (E) mouse and (F) human samples. Enlarged heatmaps with microRNA labels are shown separately as Figures S10, S11. (E) Oncomirs from mouse models are shown as a series of panels (i–iv). Panel i compares oncogenic miRNA expression between control mice and individual TIVE xenograft mice. Profiling data from the transgenic mouse model encoding the KSHV latency locus is shown in Panel ii with control mice and the average of the TIVE xenograft data. Panels iii and iv show two separate clusters of miRNA expression and compare control and transgenic mice to the primary human PEL pleural fluid cases. Abbreviations of mouse samples are as follows: CMP – control mouse plasma, CMS – control mouse serum, TIVE 1–3, individual TIVE xenograft mice, tg – 801 latency locus mouse model, PF – primary human PEL pleural fluid, exo – exosomes, sup – exosome-depleted supernatants. (F) Oncomir expression in human samples is shown as two separate clusters of expression. For the human oncomiR heatmap, sample lanes from left to right are: CHP sup pre-exo - control human plasma supernatant pre-ExoQuick, CHP E – control human plasma exosomes, CHP S – control human plasma exosome-depleted supernatant, RNase CHP E – RNase-treated CHP exo, RNase CHP S – RNase-treated CHP sup, AMT E – AIDS Malignancy, non-KS exo, AMT S – AIDS Malignancy, non-KS sup, KS E – Kaposi's sarcoma exosomes, KS S – Kaposi's sarcoma exosome-depleted supernatant, PF E – pleural fluid exosomes, PF S – pleural fluid exosome-depleted supernatant. Red denotes high expression, green denotes low expression and black is basal or intermediate expression.

