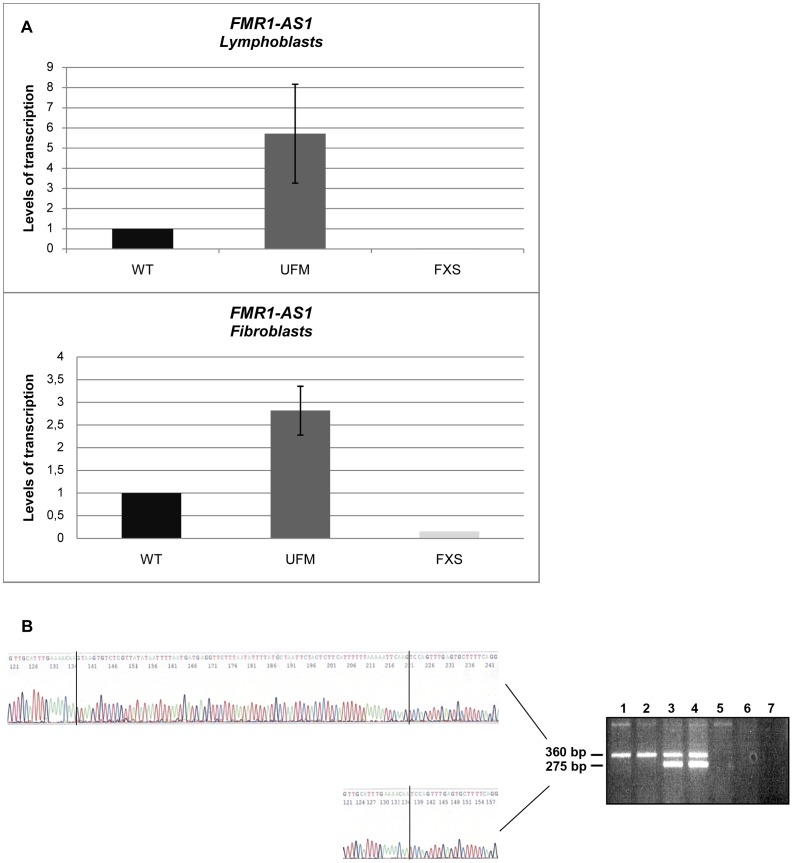
Figure 1. Characterization of FMR1-AS1 transcript in UFM cell lines.
(A) Quantification of antisense transcript through RT-PCR in WT, UFM and FXS lymphoblasts (n = 5) and fibroblasts (n = 4). (B) Strand specific RT-PCR (on the right) spanning the position +10243 to +210 bp (Genbank L29074) in lymphoblastoid cells: WT (lanes 1 and 2), UFM (lanes 3 and 4), FXS (lanes 5 and 6), no template control (lane 7). Sequencing analysis (on the left) representing the two isoforms of antisense transcript identified in UFM cells with the non-consensus CT to AC splice site in the intron 1 (360 bp isoform) and 2 (275 bp isoform) of FMR1 gene.

