
Figure 2. CTCF binding sites on FMR1 locus.
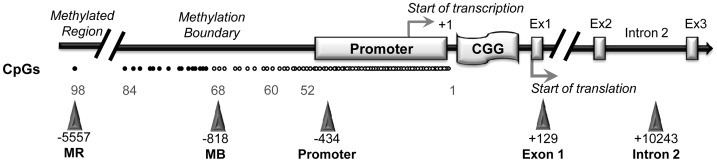
A schematic outline of CTCF binding sites spanning the FMR1 locus (white dot = unmethylated CpG; black dot = methylated CpG). Triangles indicate CTCF binding sites. Promoter, exon 1, intron 2 and methylation boundary (indicated as MB) sites had been previously described [33]; the site present in the upstream methylated region (indicated as MR) was identified through the database available online [34]. The transcription start site is reported as +1, as referred to Genbank L29074.