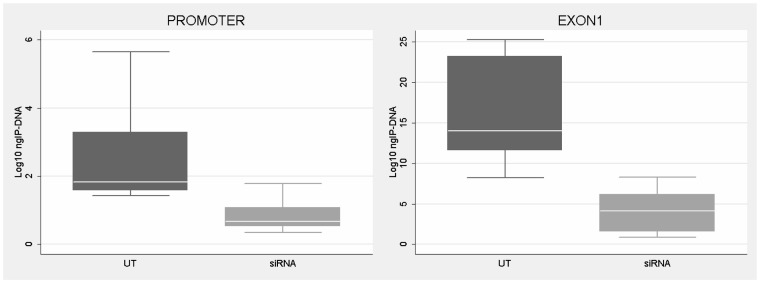
Figure 6. CTCF binding analysis on FMR1 gene after CTCF knock-down.
ChIP assay demonstrates the decrease of CTCF binding on FMR1 promoter and exon 1 in WT fibroblasts after CTCF knock-down and FMR1 reduction. Box-plots indicate the mean of at least three independent experiments, the corresponding standard error and standard deviation (thin lines). For both regions analyzed the level of CTCF binding in untreated WT (UT) is significantly higher respect to cells treated with siRNA against CTCF (siRNA) (p = 0.0003 for promoter region; p = 0.0001 for exon1). Note that the amount of IP-DNA (ng) is indicated on a logarithmic scale. ChIP experiments included negative controls performed by IgG immunoprecipitation and no template control (not shown).

