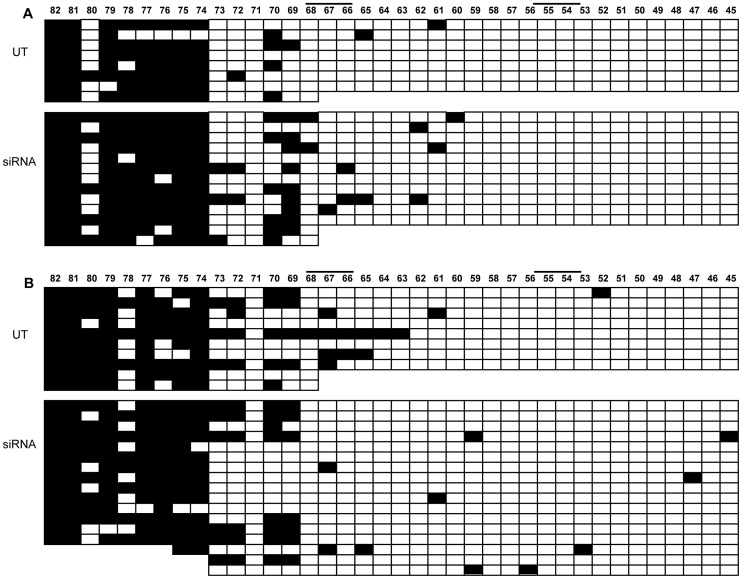
Figure 8. Methylation analysis of FMR1 locus after CTCF knock-down.
Bisulfite sequencing of 82 CpGs within the 5′-UTR of FMR1 gene after CTCF knock-down in WT (A) and UFM (B) fibroblasts. Every line corresponds to bisulfite sequencing of an individual cell. Black and white squares correspond to methylated and unmethylated CpG sites, respectively. In this experiment the FMR1 transcriptional reduction was around 30% with a residual 20% of CTCF transcript. In spite of FMR1 transcriptional reduction (indicated as siRNA), there was no methylation spreading towards active FMR1 promoter, that remained unmethylated as in an untreated control (UT). Note that CpG pairs between 45 and 54 are within the promoter region. Black bars indicate CTCF binding sites in the MB and in the promoter region.

