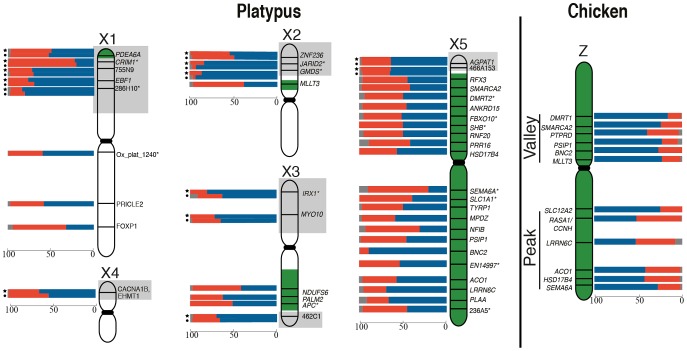
Figure 1. RNA-FISH activity maps of the platypus Xs and chicken Z chromosomes.
Bars represent the percentage of homogametic nuclei transcribing 2 (blue), 1 (red) or 0 (grey) alleles for each locus. Loci in pseudoautosomal regions (grey boxes) were tested in both male (indicated by a circle) and female (indicated by a star). Green coloring on platypus Xs represents homology to the chicken Z [23]. Platypus X chromosomes are not to scale (see Figure S5). Genes denoted by * were analysed in [24].

