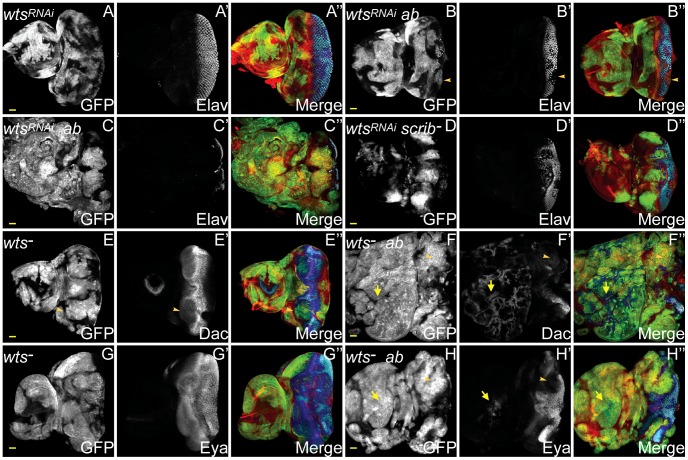
Figure 7. ab cooperates with impaired Hippo pathway signalling to drive tumour overgrowth.
ey-FLP induced eye/antennal disc clones marked by GFP (white, or green in merges). The cell fate markers Elav, Dac and Eya are shown in white (blue in merged images, changing to dark blue when overlaid with GFP). F-actin for cell morphology is in red. GFP (panels A–H), Elav (panels A′–D′), Dac (panels E′F′), Eya (panels G′H′), and merges (panels A″–H″). (A) wtsRNAi-expressing clones exhibit the normal pattern of Elav in the eye disc. (B) Coexpressing wtsRNAi+ab in clones decreases Elav expression in some (B, arrowhead), but not all clones, and some larvae enter an extended larval stage, during which massive overgrowth of Elav-negative tissue ensues (C). (D) Overexpressing wtsRNAi in scrib mutant clones increases scrib mutant clone size and reduces Elav expression, but does not result in cooperative tumour overgrowth throughout an extended larval stage. (E) wtsX1 clones exhibit mildly reduced Dac levels in anterior localised clonal tissue in the eye (E, arrowhead), and also reduced expression in the antennal disc. (F) In wtsX1+ab clones, overgrowing tissue within the eye disc does not express Dac (F, arrowhead), although extensive ectopic Dac expression is observed throughout the antennal disc (F, arrow). (G) Eya expression in wtsX1 clones is largely unperturbed. (H) wtsX1+ab clones overgrow in the eye disc, and do not express Eya (H, arrowhead), however, occasional Eya positive tissue is sometimes observed within the antennal disc region (H, arrow). Yellow scale bar = 50 µm.

